Wednesday - Day 3
Wednesday - 2 short, 2 full
- VIS Full Papers: Transforming Tabular Data and Grammars - Alex Lex
- VIS Full Papers: Understanding and Modeling How People Respond to Visualizations - Carolina Nobre
- VIS Short Papers: Visualization Systems and Graph Visualization - Kat Isaacs
- VIS Short Papers: Visual Analytics, Decision Support, and Machine Learning - Matthew Berger (handled qa)
Highlights
- Tabular data and gramars
- visualizations + recommendations can help w/ both graph config, data transforms, and query formula definitions (e.g verb previews)
- HiTailor: "recipes" can fit into categories (change, distro)
- Animated Vega Lite for presentation quality / DSLs for API design on core-viz
- visualizations + recommendations can help w/ both graph config, data transforms, and query formula definitions (e.g verb previews)
- Responding / Evaluation
- Examine frameworks for how we decide whether a viz is "working" (both for aesthetics and function)
- Think about epilepsy risk with animations/color choice
- Progressive loading coms (multistep queries, changing the bin size by timeframe size)
- Graph Systems
- nl4dv python package: build graphs in stages to learn VL. See tweet
- Vega Fusion: for expensive vega lite specs
- resampler: a visualization-aware sampling algorithm - could use in experimental form with tiny buckets for big timeseseries that need more detail over long time periods.
- Decision Support / VA / Machine Learning
- TimberTrek, Visual Auditor, Fuzzy Spreadsheets: all ways to fit into existing workflows (notebooks, sheets)
- TimberTrek in particular: make use of sticky panes + an attribute-based tree slicer?
- May need to make use of funnels, service level meatdata, etc
- FairFuse: Do we have different ranking algos to compare?
- ML explainability: explaining rule classifiers + compare behavior in subgroups
- "Active Search": Recommend follow-up items in "real time"?
- TimberTrek, Visual Auditor, Fuzzy Spreadsheets: all ways to fit into existing workflows (notebooks, sheets)
- Hallway Track
- Practice notebook plugin-making
- https://arxiv.org/pdf/2205.03963.pdf / https://github.com/poloclub/nova
- Roundtrip (Katherine Isaacs): https://github.com/hdc-arizona/roundtrip
- Practice notebook plugin-making
Raw Notes
Tabular Data + Grammars
- 3 papers from 1 uni (Zhejiang Lab) about visualizing spreadsheet activity and data transforms
- Revealing the Semantics of Data Wrangling Scripts With COMANTICS - Kai Xiong
- Reverse engineer "semantics" (json descriptor) of data transform behavior with Python and R
- Maybe someday use to help optimize code
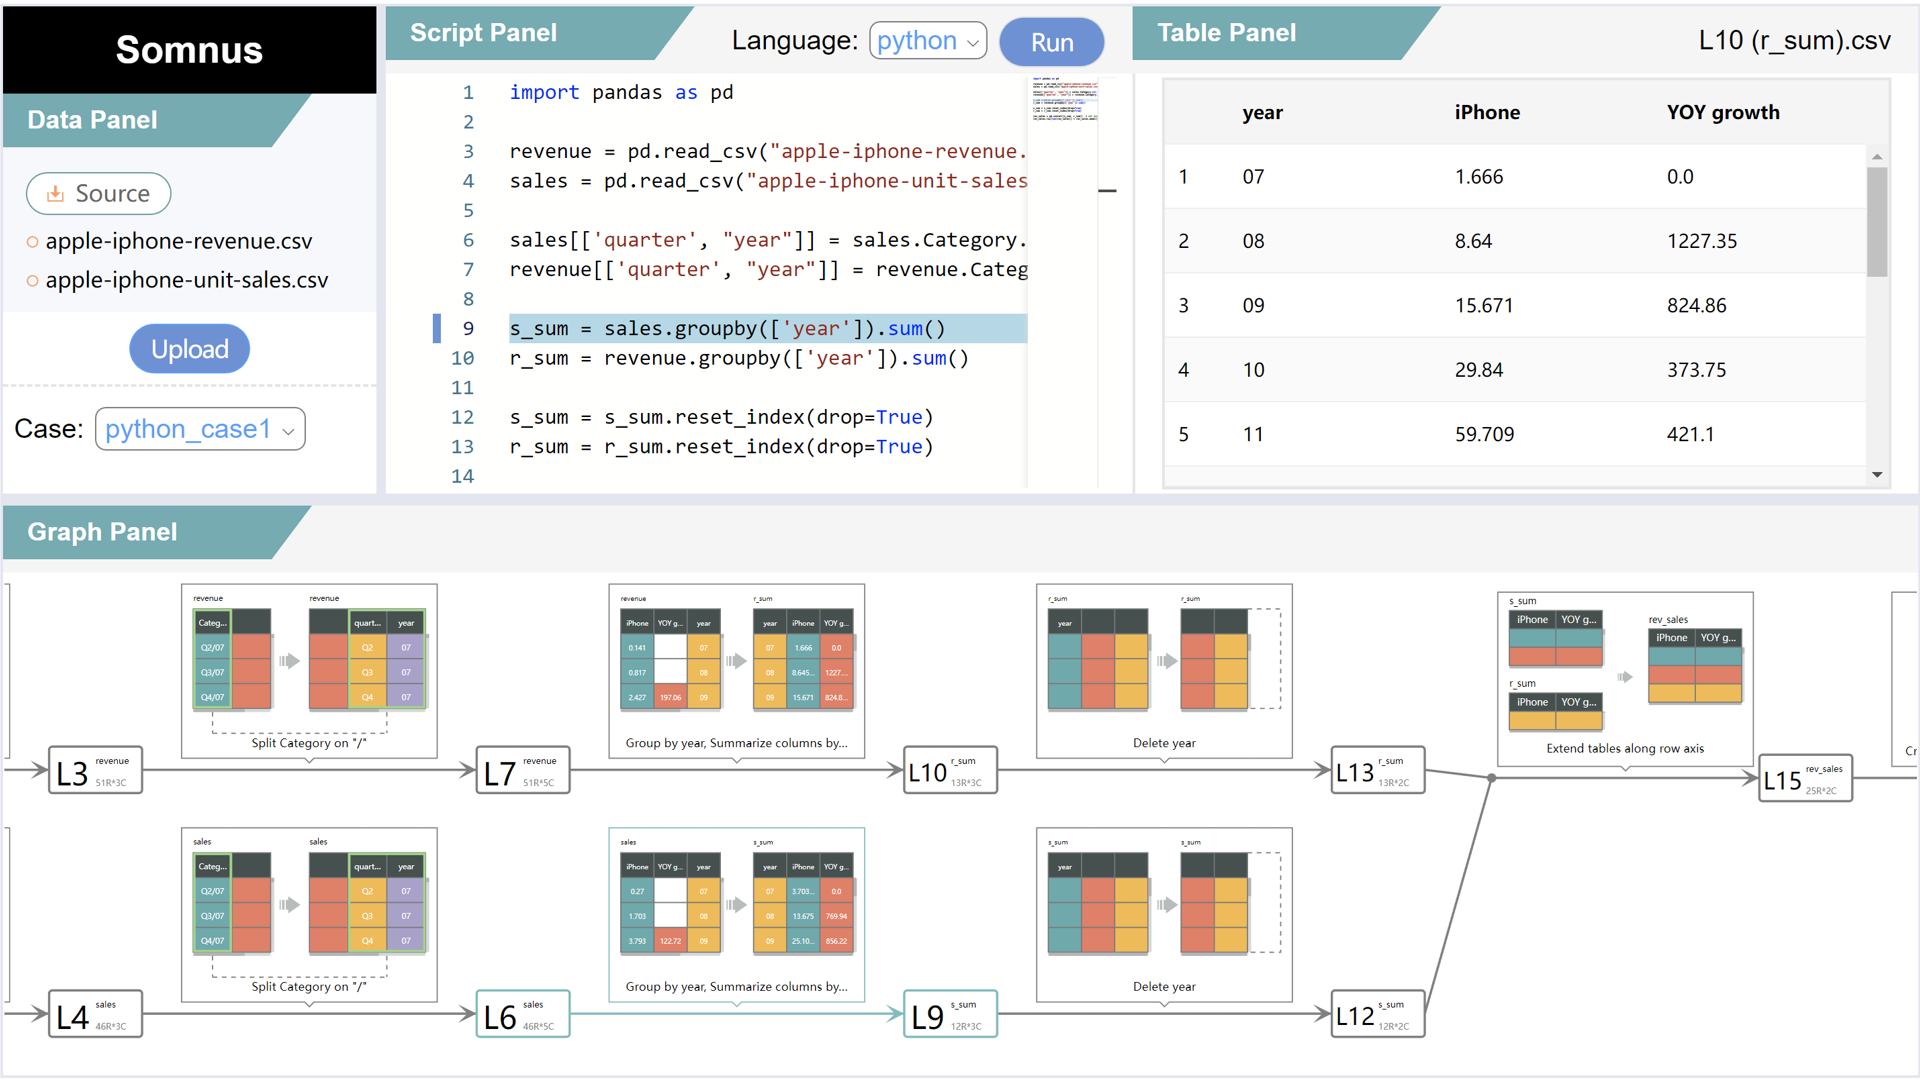
- Visualizing the Scripts of Data Wrangling with SOMNUS #to-read https://arxiv.org/pdf/2209.13981.pdf - Kai Xiong
- Use visual GLYPHS
- Pic: https://ieeevis.b-cdn.net/vis_2022/paper_images/v-tvcg-9693232.png
- Use output of previous paper in visualization
- Pipeline (adapter -> renderer) seems generalizable
- Lots of background work on program visualization / data provenance
- Developed glyphs for showing what diferent verbs do
- Me: check arquero, rxjs marbles, etc
- Nice use of diagram linked to explain code behavior, with data preview
- Me reactions
- meta: pick verbs to illustrator: check Data-APIs : https://data-apis.org/array-api/latest/API_specification/index.html
- Check exploratory.io / arquero verbs: https://observablehq.com/@uwdata/an-illustrated-guide-to-arquero-verbs?collection=@uwdata/arquero
- Also: alteryx / wrangler glyphs: https://observablehq.com/@observablehq/data-wrangler
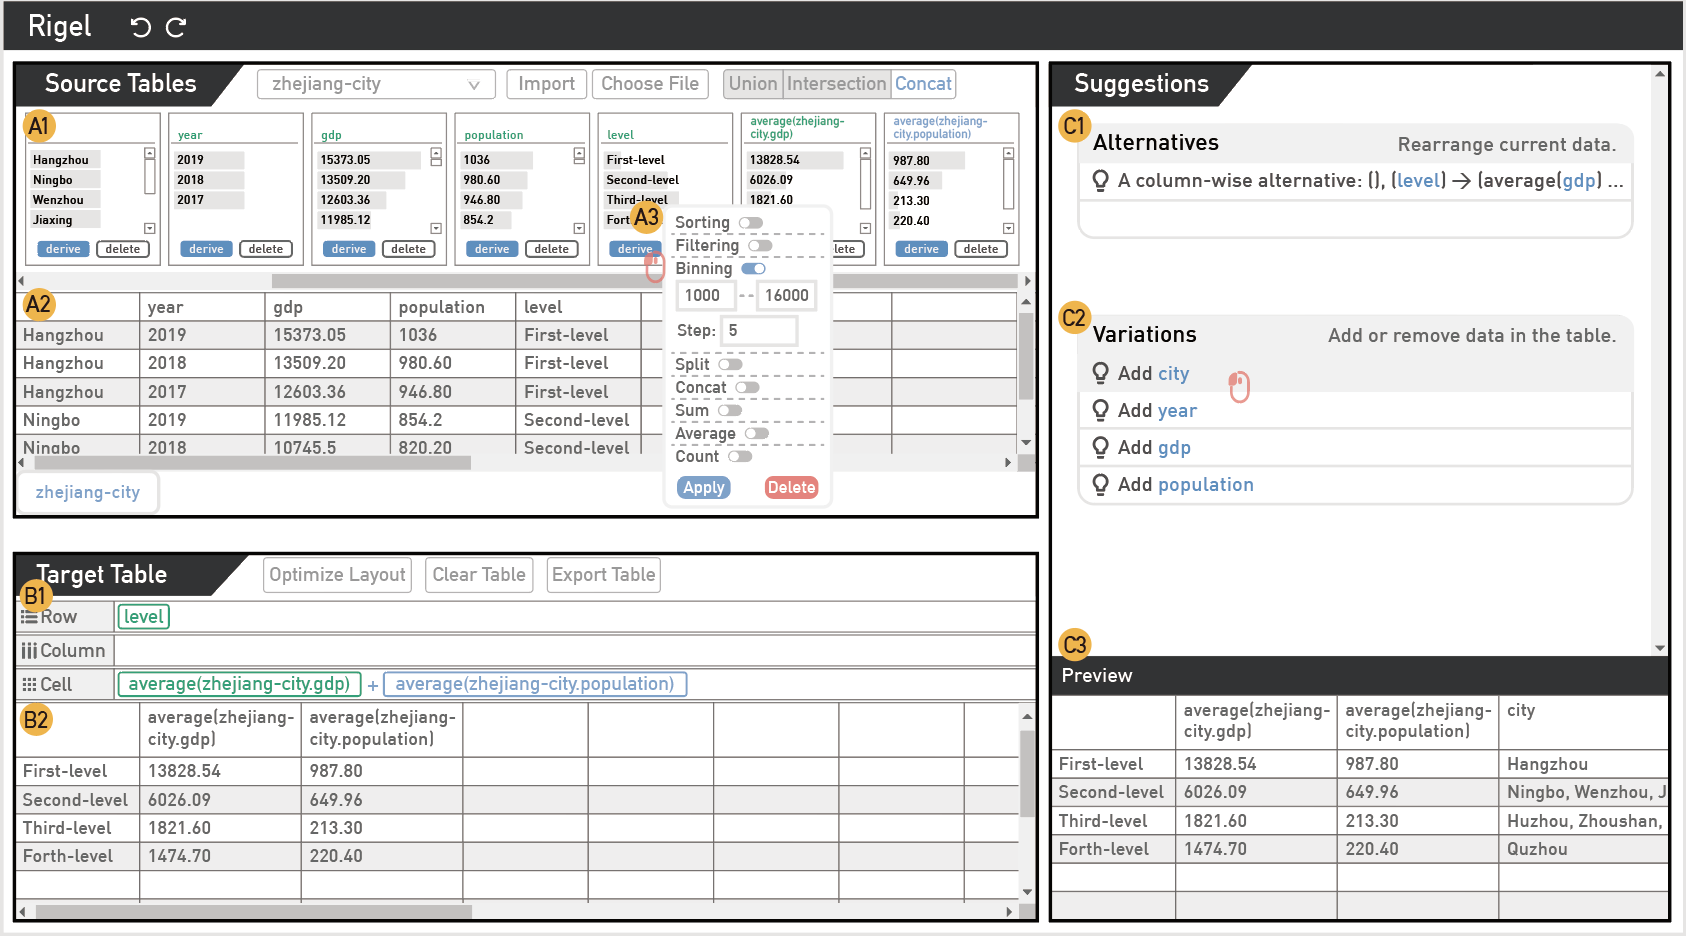
- Rigel: Transforming Tabular Data By Declarative Mapping
- #demo : https://rigel-system.github.io/rigel-system/
- https://ieeevis.b-cdn.net/vis_2022/pdfs/v-full-1171.pdf
- https://ieeevis.b-cdn.net/vis_2022/paper_images/v-full-1171.png
- Prior work: foofah helped with synthesizing transform programs by demonstration: https://github.com/rigel-js/foofah
- GUI to help people recommend data transforms- choose right follow-up fields and attributes!
- Good use of color-coding to navigate row, column, cell transforms
- https://github.com/rigel-js/rigel-system
- https://github.com/rigel-js/rigel.js
- https://observablehq.com/@rigel/appendix
- HiTailor: Interactive Transformation and Visualization for Hierarchical Tabular Data
- #demo : https://hitailor.github.io/
- https://github.com/bitvis2021/HiTailor
- Ideas for a data illustrator, lots of background work on tabular visualization (Taco, bertifier)
- Helps with rearranging hierarchical / pivot tables...
- To-reead
- Video game sales data : https://www.vgchartz.com/tools/hw_date.php videogame charts
- https://github.com/bitvis2021/hitailor
- Animated Vega Lite: (jonathan and Josh Pollock (Discorded after))
- Added time as a new encoding (me... implicitly = filter since it can't be bound to other visual attrs)
- http://vis.csail.mit.edu/pubs/animated-vega-lite/#S3.T1
- Strong slides style, pacing
- Meta: "expert critical reflections"- had developers of 4 prior animation grammars use this
- Aside: messaged Irene about her swimming viz inspo: https://data-animator.com/gallery/swimming_world_records.html
- Data Animator is slick
- Coming to vega-lite core: https://github.com/vega/vega-lite/issues/4060
- Open question... should interpolation frames be global or based on every step? Or is that out of grammar scope
- Grammar taketh and giveth different regions of design space.
- related tabs
- Josh updated his blog: https://joshmpollock.com/blog/formality-considered-harmful/
- Encouraging relaxing formality sometimes- pay attention to why jupyter and excel are popular: https://link.springer.com/content/pdf/10.1023/A:1008716330212.pdf
- Tidy up python code: https://github.com/LineaLabs/lineapy
- No Grammar to Rule Them All: A Survey of JSON-style DSLs for Visualization (RECOMMENDED GALLERY)
- JSON Dsls ( @andrew.mcnutt (Private) , discorded after)
- https://virtual.ieeevis.org/year/2022/paper_v-full-1045.html
- https://ieeevis.b-cdn.net/vis_2022/pdfs/v-full-1045.pdf
- 4395 code examples, across 57 languages
- browse table for thematic concerns / ops
- STudy what makes colloquial languages popular (like matplot etc)
- Beware debuggability of "compiler towers" (gantt , vega lite, vega, js, etc....)
- Advantages of languages (xml -> json etc...) it's just the preference of the era, linting, tooling
- Realize Josh Pollock got JSONC (comments and trailing) are OK: https://github.com/vega/editor/pull/1147
- Object names without quotes are OK
- multiline strings are OK
- HiJSON: https://hjson.github.io/: affordance into
- Next future...
VIS Full Papers: Understanding and Modeling How People Respond to Visualizations
- A Survey of Perception-Based Visualization Studies by Task (Ghulam)
- Best Phd Thesis award: Ghulam Jilani Quadri
- https://arxiv.org/abs/2107.07477
- Paper isolator: https://usfdatavisualization.github.io/VisPerceptionSurvey/index.html
- Vis "effectiveness" is going to depend on the task type, not helpful to say "pie charts are good for this data shape" too generically
- Query studies by low level task, visual encoding, and task type. In future can also accomodate datatype
- Me meta: contrast Survis later? : https://github.com/fabian-beck/survis
- BeauVis: A Validated Scale for Measuring the Aesthetic Pleasure of Visual Representations
- https://virtual.ieeevis.org/year/2022/paper_v-full-1219.html
- Lesson in how to create a stable qualitative measure
- Cool "exploratory factor analysis" for culling from 100s of real words used in 3000 papers, then 209, then experts cull to 11
- Practice using stats and curation together
- Single question not stable- but if you ask enjoyable, likeable, pleasing, nice, appealing, it should work out
- Negative wasn't balanced
- Photosensitive Vis (Laura South)
- Affects 9.1 million people - not just animations, but also panning/zoom/selection etc, quite dangerous
- Focus on parts where you have authorial content
- SOme things you can't control (ixel size) - adjacent element flicker vs flash (3x in 1 second, luminance changes
- Learned how epilipsy is tested usually (video software)
- more on dataviz Accessibility
- https://www.kekewu.me/research : color crafter (designer quality ramps)
- Me: https://developer.mozilla.org/en-US/docs/Web/CSS/@media/prefers-reduced-motion : css property - but motion also can be triggered by color change over big service
- Unifying Effects of Direct and Relational Associations for Visual Communication (#semantic-colors)
- What if color association is reversed with semantic meaning (e.g. darker = sense of more)
- Opaque, hotspots, high, etc...
- Q&A
- Thinking about multilingual color associations https://idl.cs.washington.edu/papers/multi-lingual-color-names/
- Korea, Russia have multiple "blue" names?
- What if color association is reversed with semantic meaning (e.g. darker = sense of more)
- A scanner deeply : Heatmap for eyetracking from home
- Can use webtacker library to self scans: https://webgazer.cs.brown.edu/
- (Elmqvist Discord)
- Me
- Describe pipeline you could self-create to predict where eyes go, using 12,000 gaze maps from test data
- Programmatic masking
- Learned about VAS via Carol (3m eye tracking AI)
- Studying Early Decision Making with Progressive Bar Charts
- https://ieeevis.b-cdn.net/vis_2022/pdfs/v-full-1254.pdf
- Thrust (discussed with @dominik.moritz (Private) on Discord): will people make bad guesses if you give them early results on partial data?
- Human actually do well: baseline, CI, history (grouped bars), history with CI. (Ok even with wiggling baseline)
- Key paper: https://idl.cs.washington.edu/papers/trust-but-verify/ Pangloss system for progressive load
- Recommended his Pangloss
- Link with Jean daniel feneke call on progressive vis in Data Science keynote
VIS Short Papers: Visualization Systems and Graph Visualization
- Facilitating Conversational Interaction in Natural Language Interfaces for Visualization
- Rishab Mitra, Arpit Narechania, Alex Endert, John Stasko
- Demo: https://github.com/nl4dv/nl4dv / https://nl4dv.github.io/nl4dv/documentation.html
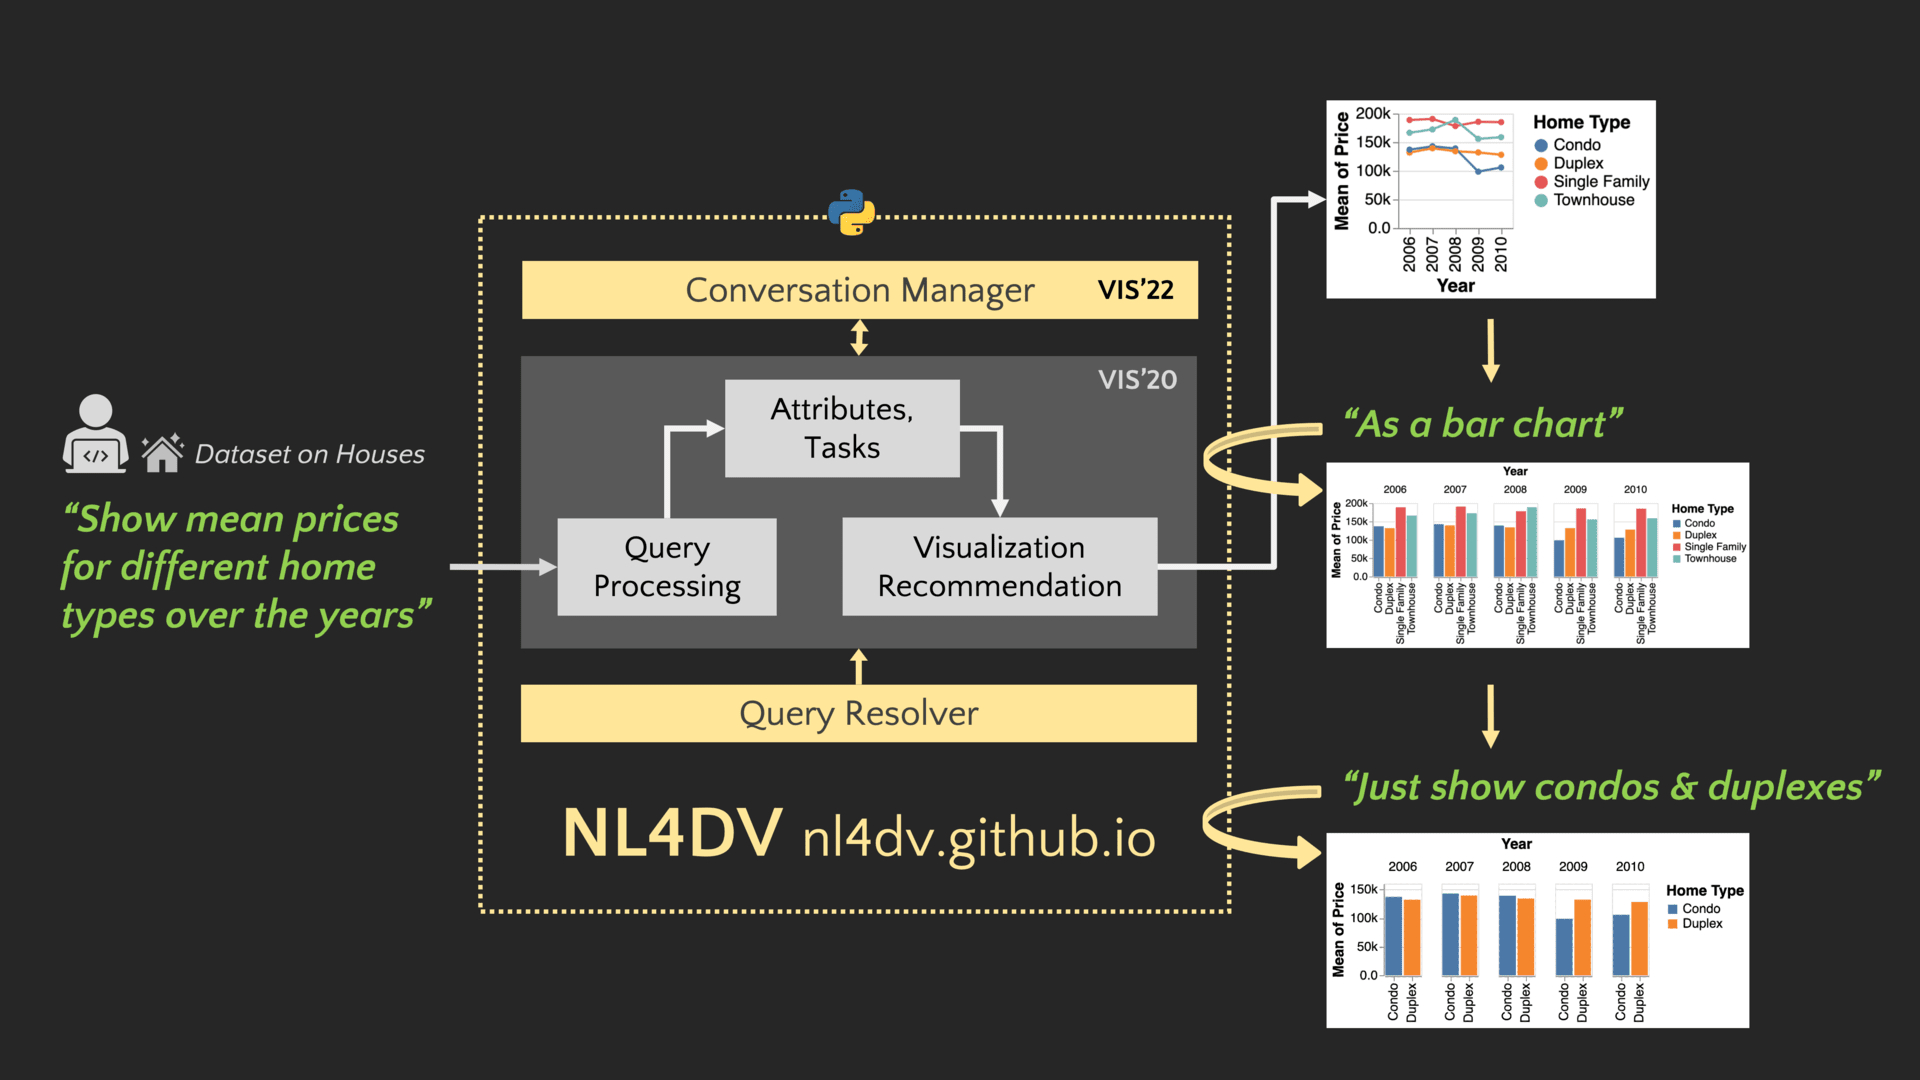
- Insight - 1 shot query is fragile, what if you do it 1 at a time?
- "show me mean prices for home types, over the years"
- Then as a bar chart
- Then just condos
- I tweeted about this as a path to incrementally learning vega-lite too:
- Aside: @arpit.narechania (Private)'s website is is cooL!
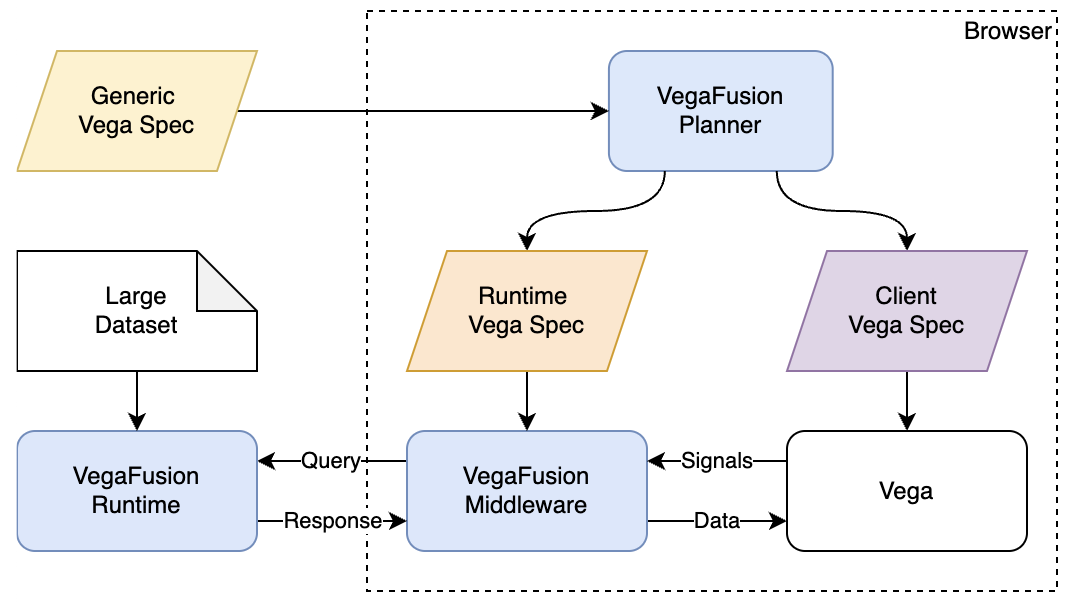
- VegaFusion: Automatic Server-Side Scaling for Interactive Vega Visualizations
- https://ieeevis.b-cdn.net/vis_2022/pdfs/v-short-1044.pdf
- https://virtual.ieeevis.org/year/2022/paper_v-short-1044.html
- Arch: https://ieeevis.b-cdn.net/vis_2022/paper_images/v-short-1044.png
- Blog for how it works: https://medium.com/@jonmmease/announcing-vegafusion-570f62207ba7
- Nicholas Kruchten and Jon Mease of Plotly
- Faster runtime execution of vega because only the columns you need are pushed to client. Bigger gains if spec uses filtering and/or aggregation. Also has runtime cache for interactions
- Has gains even on same machine, no big compute needed.
- This is something we could try at Datadog...
- Streamlining Visualization Authoring in D3 Through User-Driven Templates
- Based on to Leilani's "best short paper" award that started back in 2018
- Hannah K. Bako, Alisha Varma, Anuoluwapo Faboro, Mahreen Haider, Favour Nerrise, Bissaka Kenah, Leilani Battle
- Analyzed 2500 examples of D3 from online sources
- Gist: https://ieeevis.b-cdn.net/vis_2022/pdfs/v-short-1098.pdf
- https://osf.io/k58bp/?view_only=72fa3798bbaa4263b5ad662b26a70cb3
- https://observablehq.com/@thisistaimur/warc-study-analysis
- 5 graph types handle 80% of viz types (bar, line, map, network, scatter) - design templates
- Had a shoutout for @andrew.mcnutt (Private)'s Ivy tool!
- Make reusable templates for graph types - sharing behaviors is harder
- Plotly-Resampler: Effective Visual Analytics for Large Time Series #to-read
- Phd Twins!
- https://ieeevis.b-cdn.net/vis_2022/pdfs/v-short-1021.pdf
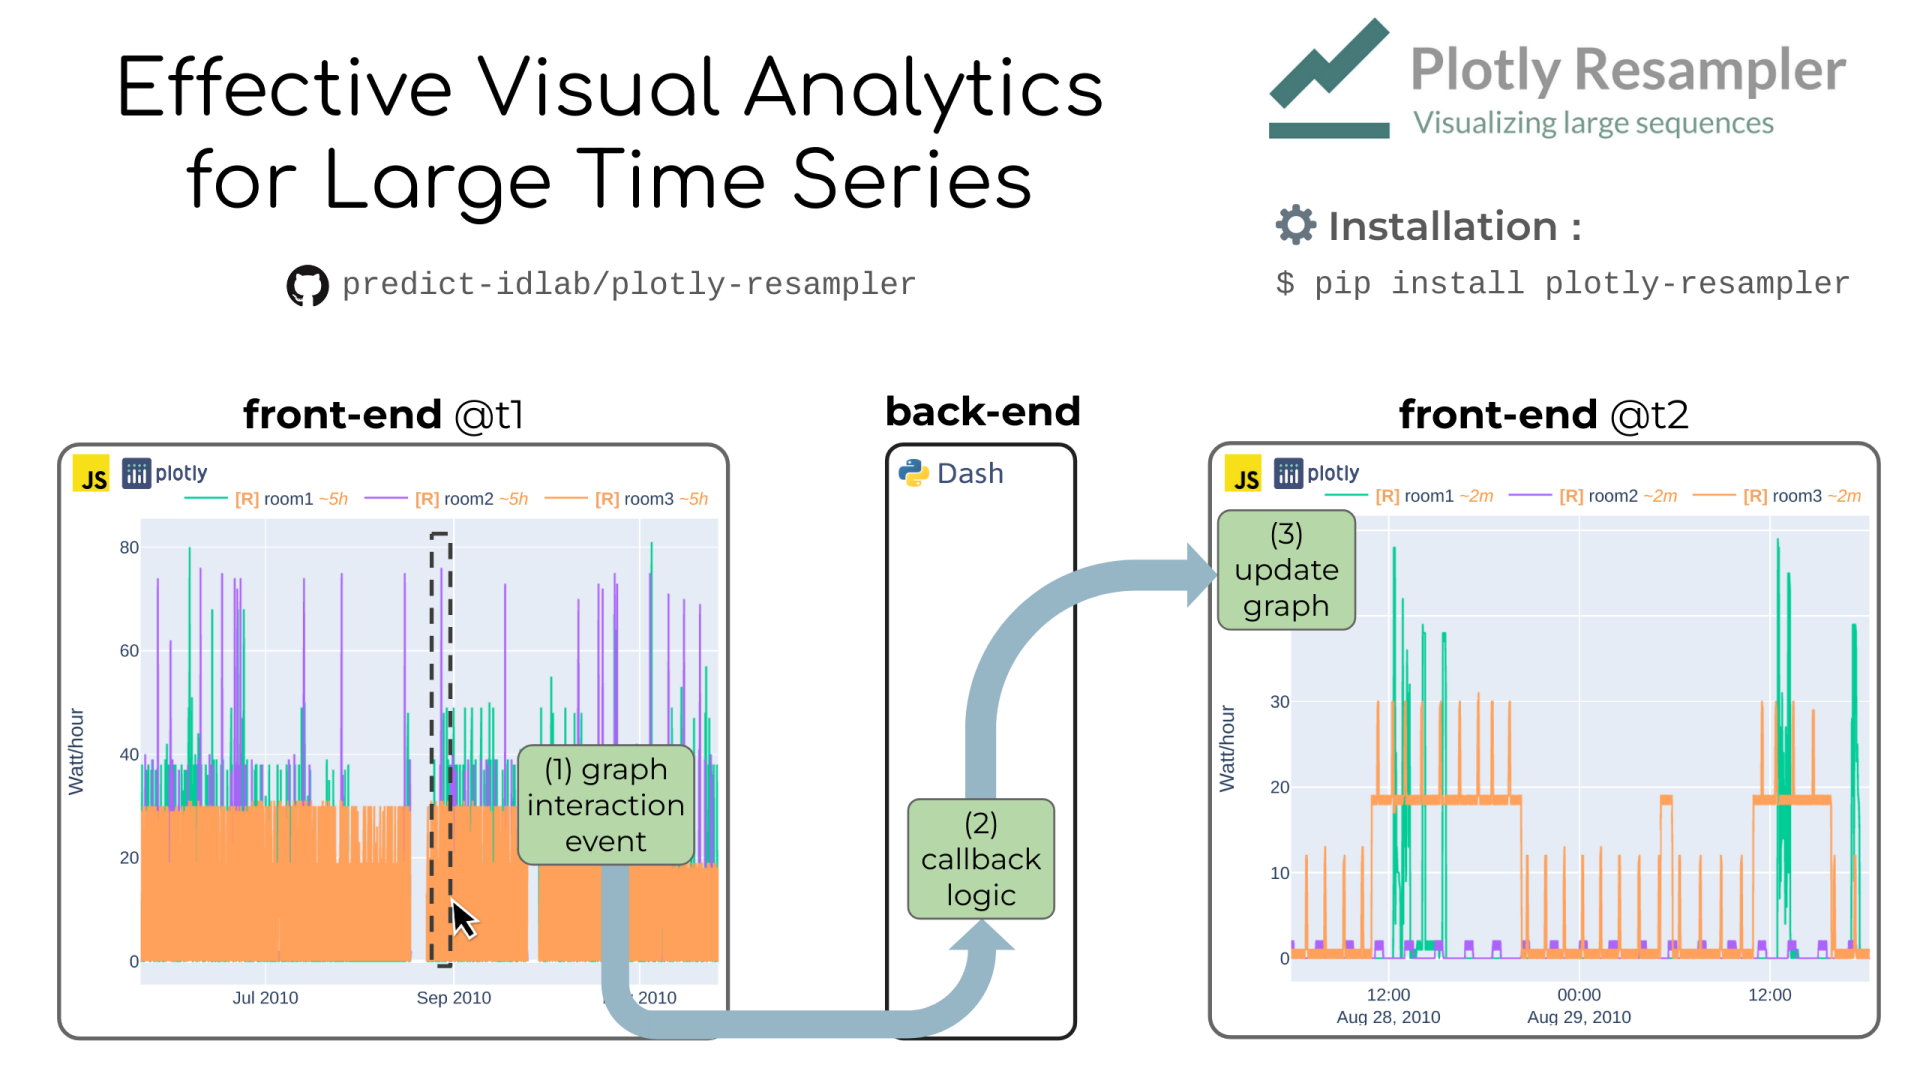
- #demo : https://github.com/predict-idlab/plotly-resampler
- Sample data in timeseries, and before sending to frontend, avoids JS crashing
- Handle 110 million point case
- @dominik.moritz (Private) recommended sampling algo
- Great example of fitting into existing workflows
- Has a cool demo video + annootation completely
- As for now, our default aggregator is Largest-Triangle-Three-Buckets (LTTB). M4 aims to create pixel-perfect aggregation, and is a worthwhile aggregator to use!
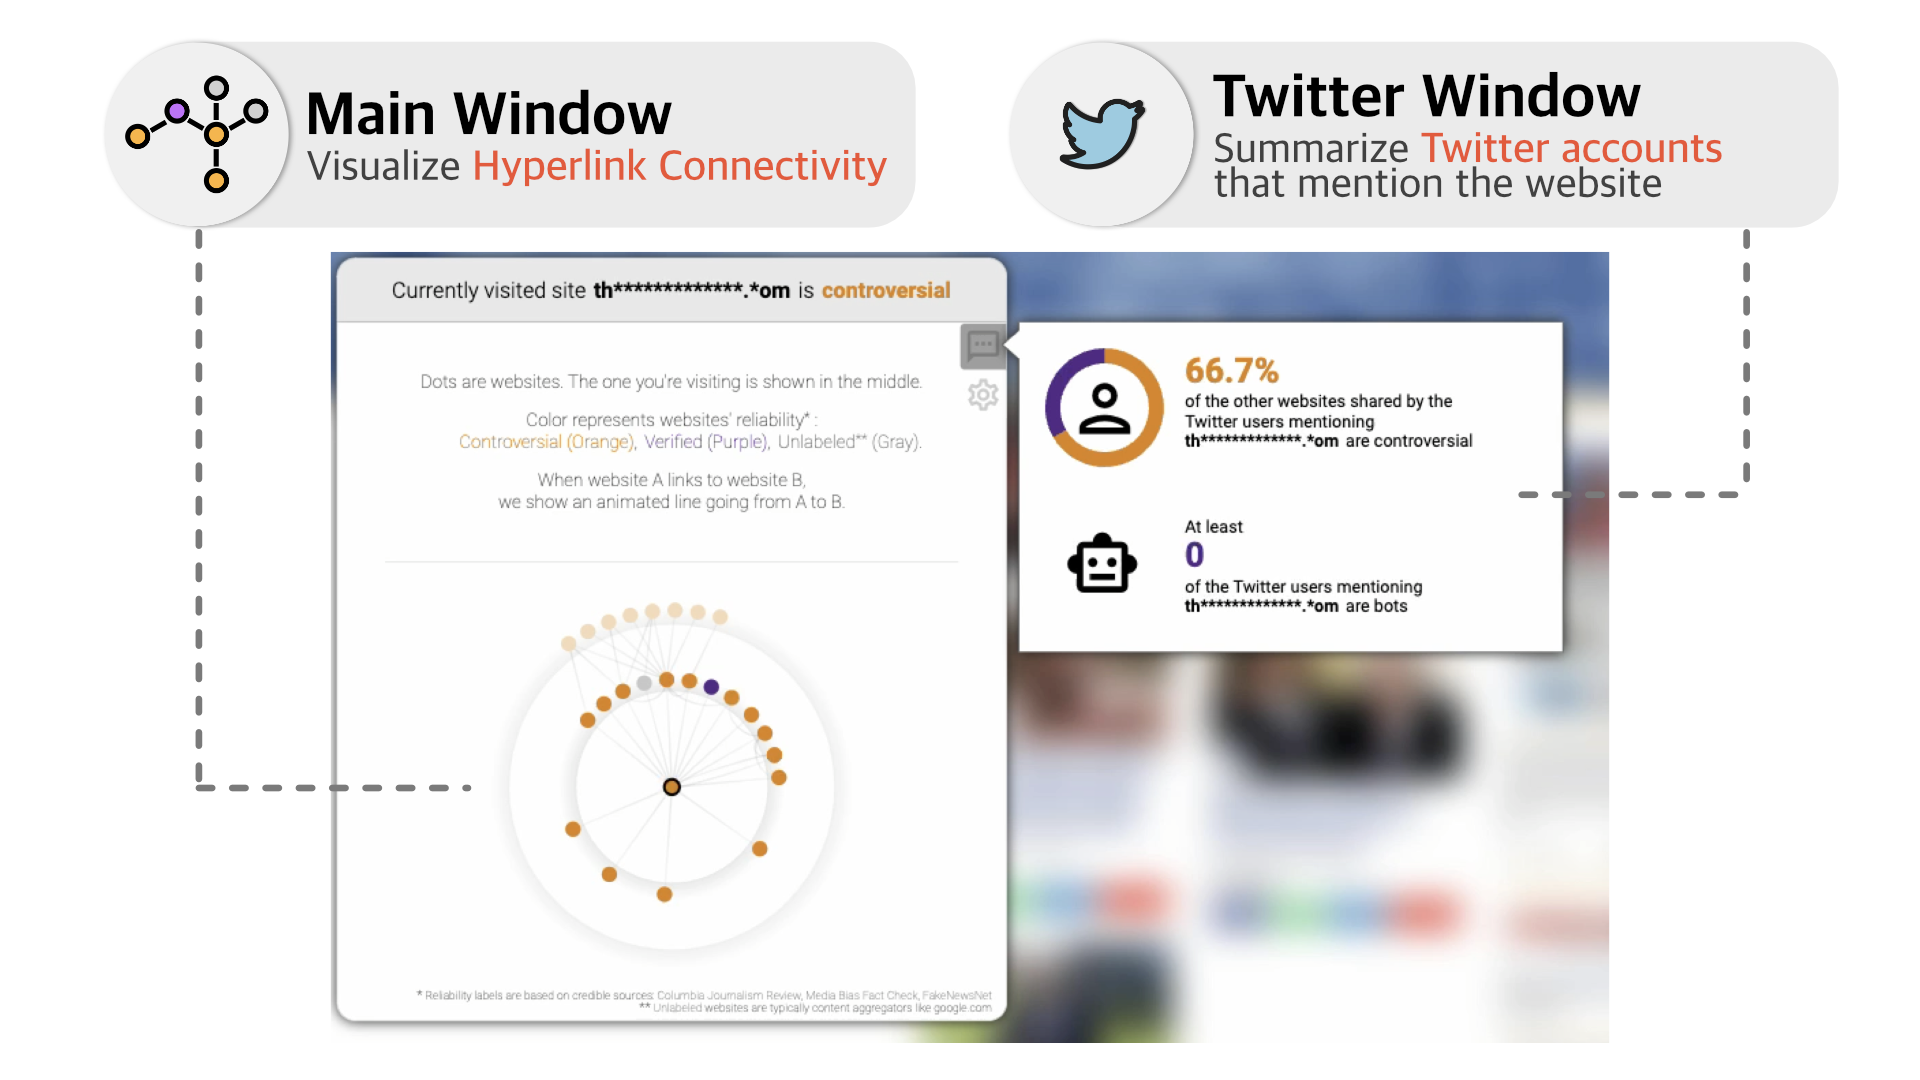
- Explaining Website Reliability by Visualizing Hyperlink Connectivity (MisVis)
- https://ieeevis.b-cdn.net/vis_2022/pdfs/v-short-1011.pdf #to-read
- https://ieeevis.b-cdn.net/vis_2022/paper_images/v-short-1011.png
- Great idea for network topology-> show network data about an entity as you browse web in-context. Via GaTech (polo club)
- Horizontal hops on inner rungs are possible
- https://poloclub.github.io/MisVis #demo
- Paths through Spatial Networks
- https://virtual.ieeevis.org/year/2022/paper_v-short-1137.html
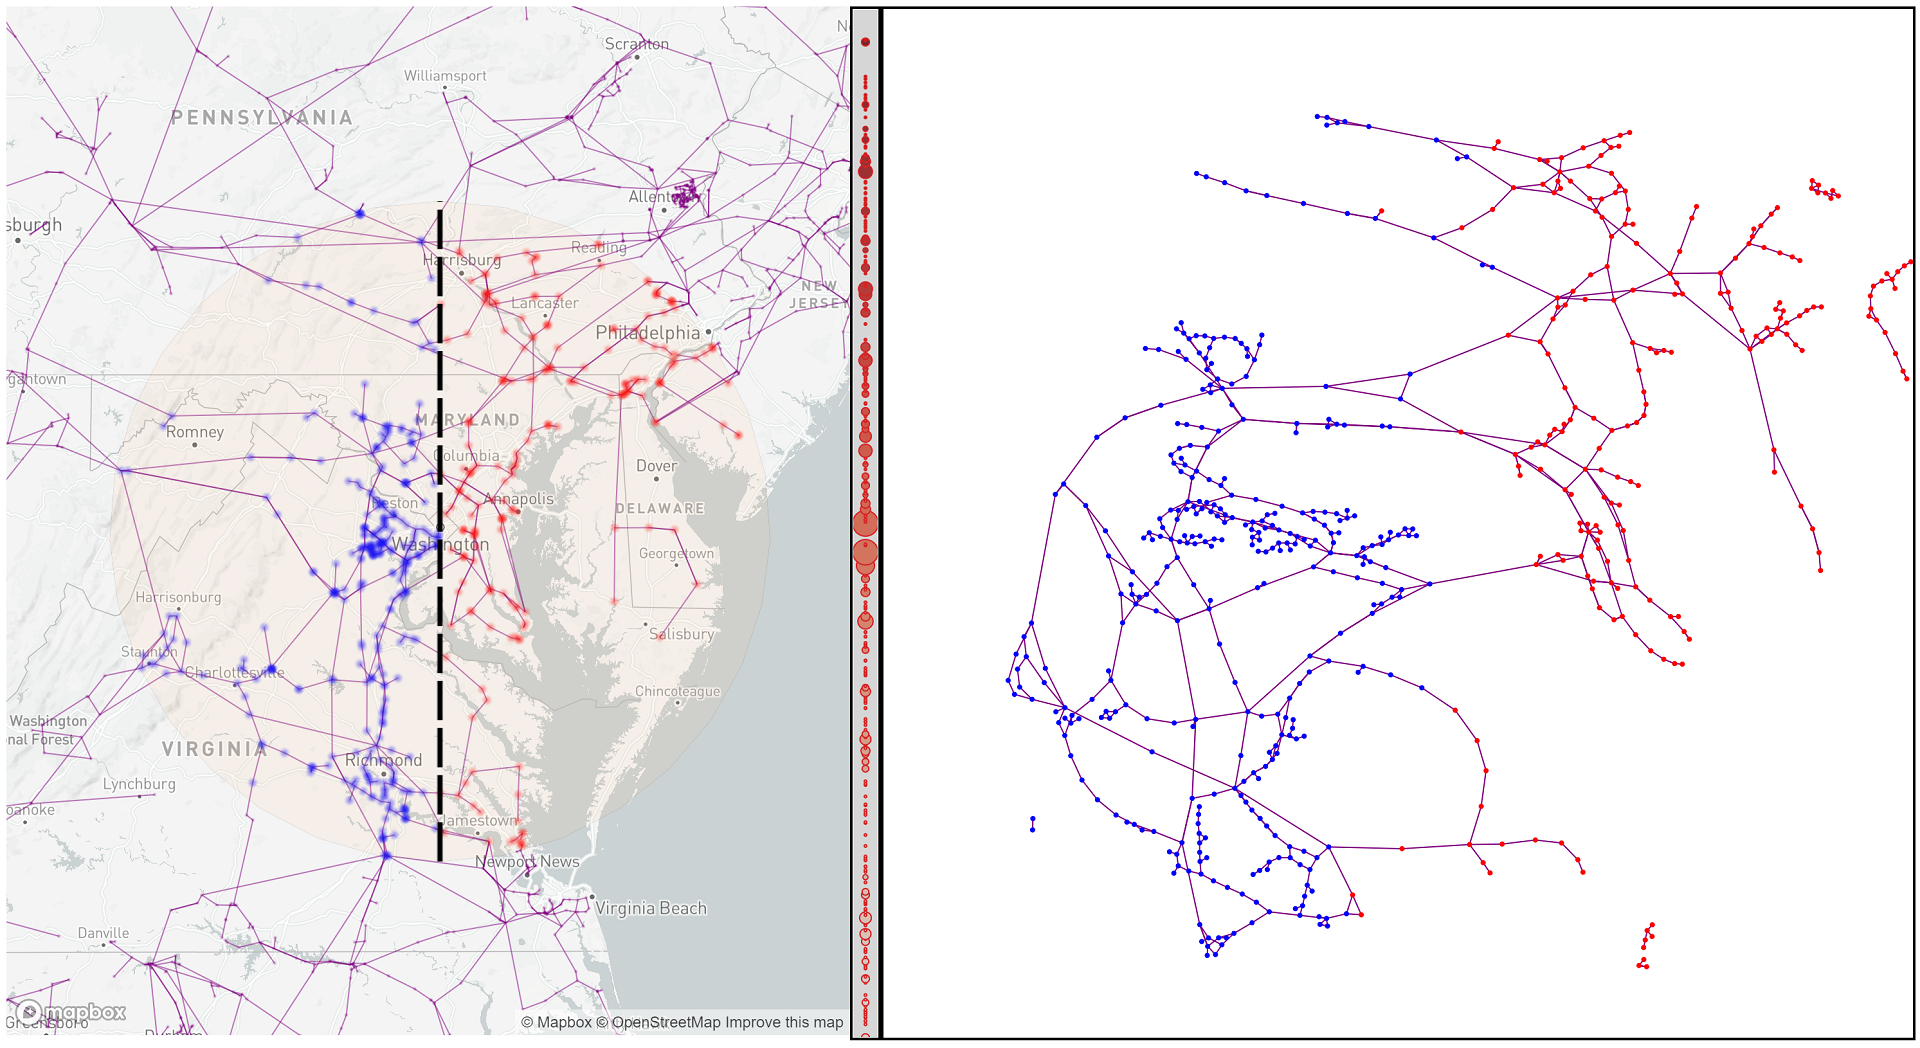
- Can you visualize network topology and geography at same time?
- Maybe links back to Geomap? (e.g. for datacenter, network vis)\
- Domain insight: higher value for telecom / network data packet hops
- Schottler survey paper (2021): analyze the 95 forms people use for geospatial networks
- Method: use D3-force to construct forces using a reference path to nudge the force directed particles - a little bit more stable than usual network graphs.
- Inside: uses turf.js and mapbox gl. They're hiring someone to help build this.
- LineCap: Line Charts for Data Visualization Captioning Models
- https://ieeevis.b-cdn.net/vis_2022/pdfs/v-short-1070.pdf
- Anita (harvard) zoom presentation
- Trained a CNN using a bunch of online workers to label sample single variable timeseries
- Using deep learning to get good captions at scale (3528) is tricky, you may need to give your labelers a narrower vocab to help seed quality
- Intentable: A Mixed-Initiative System for Intent-Based Chart Captioning

- https://ieeevis.b-cdn.net/vis_2022/pdfs/v-short-1048.pdf
- https://virtual.ieeevis.org/year/2022/paper_v-short-1048.html
- https://www.jasonchoi.dev/cv/en https://github.com/Jason-Choi/Intentable #demo
- A UI to help you make captions with human-in-loop
- Get best of "template based is fixed" and "ML based" approach in tandem (see onenote for pics)
- Example intents: request unit, title, and what type of thing you want to see (a overview, compare, trend, a distribution, etc...)
- I'm optimistic about this approach to captioning vs pushing ful full automation
- Neat: notice it learned to convert units (e.g. 1000 billion became 1.x trillion)
VIS Short Papers: Visual Analytics, Decision Support, and Machine Learning
- Visual Auditor: Interactive Visualization for Detection and Summarization of Model Biases
- https://ieeevis.b-cdn.net/vis_2022/pdfs/v-short-1004.pdf
- https://github.com/poloclub/visual-auditor/raw/master/header.png
- Visualize "bias" across multiple classifiers using Polo club's NOVA tool
- Important for cases like Recidivism
- In future, maybe handle sorting (see matrix.js from Jean-Daniel Feneke) using things other than alphabetical order
- https://visual-auditor.surge.sh/ . Even available as python package
- #demo https://github.com/poloclub/visual-auditor
- Reminded me of Missingno: https://github.com/ResidentMario/missingno
- RMExplorer: A Visual Analytics Approach to Explore the Performance and the Fairness of Disease Risk Models on Population Subgroups
- Bum Chul Kwon et all (IBM etc)
- Very polished video, makes uses of SHAP plots to help people to check risk across all subgroups (not just everyone at once). Scaled to 440k UK people
- https://www.bckwon.com/publication/rmexplorer/
- https://bckwon.com/pdf/rmexplorer.pdf #to-read
- Visualizing Rule-based Classifiers for Clinical Risk Prognosis
- https://ieeevis.b-cdn.net/vis_2022/pdfs/v-short-1105.pdf
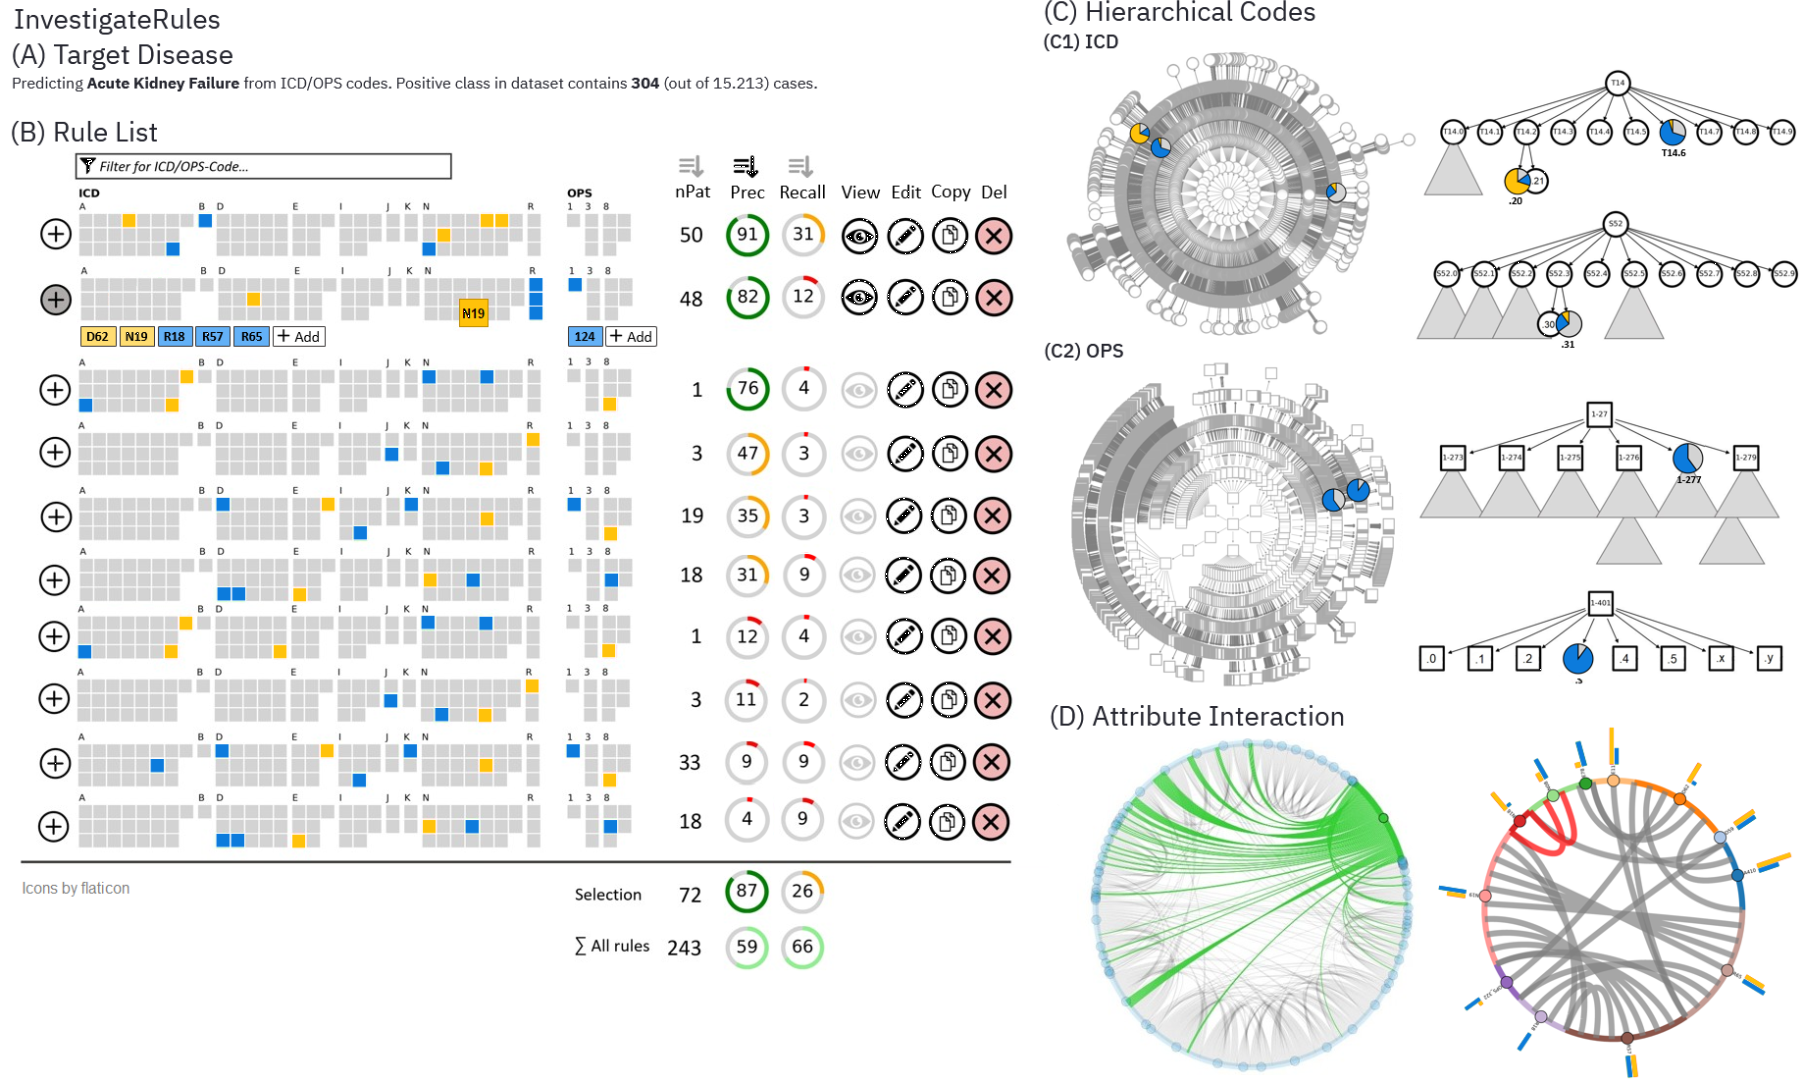
- Dario had htoughtful questions for the other presenters
- Lots of vis types: glyphs, annotated links to check (circos, hierarchy, radial, calendar vis)
- Lots of good previous work pictures
- Developed closely with doctors + real patient records, not theoretical
- TimberTrek: Exploring and Curating Sparse Decision Trees with Interactive Visualization
- Zijie J. Wang
- https://ieeevis.b-cdn.net/vis_2022/pdfs/v-short-1006.pdf #to-read
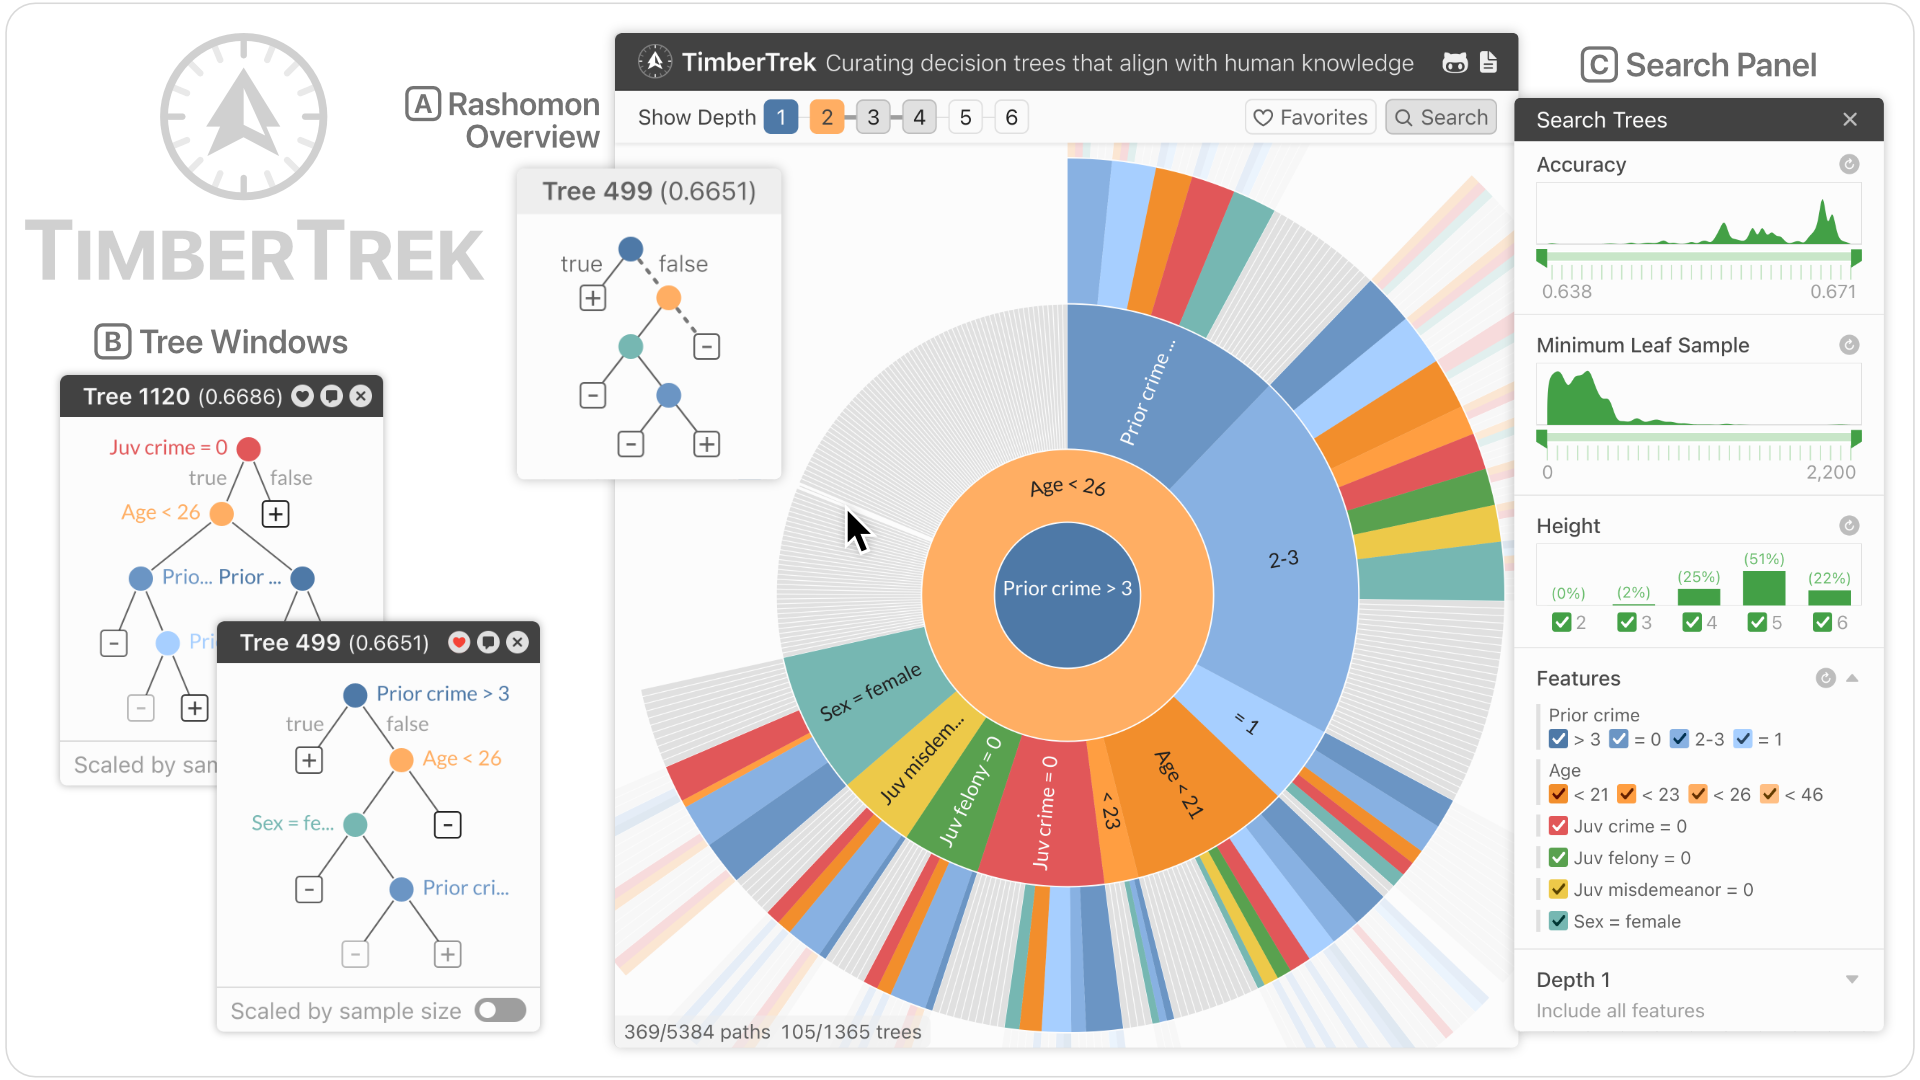
- Sparse trees are interpretable, many have similar accuracy, so can you just pick the one with the characteristics you need (e.g. avoid using sensitive columns)
- Somewhat depends on making use of the Rashomon set
- Great UI for pruning a hierarchical dataset
- Core idea: flatten trees into paths, arrange trees in a circle!
- #demo https://poloclub.github.io/timbertrek : savvy use of a sunburst vis
- Sets high bar for video production and annotation and slides
- Choosing colors was tricky for them, limits number of classes you can use
- Discussed with Shelly: nice detail are the bar charts showing the sample size that fed into each decision tree
- Combining ranking algos fairly with Fairfuse: Interactive Visual Support for Fair Consensus Ranking
- https://deepai.org/publication/fairfuse-interactive-visual-support-for-fair-consensus-ranking #demo
- (meta me: a bit tricky to know what makes a ranking fair or not, need to read paper closer / Hilson Shrestha
- Both front and backend are OSS: https://osf.io/hd639/
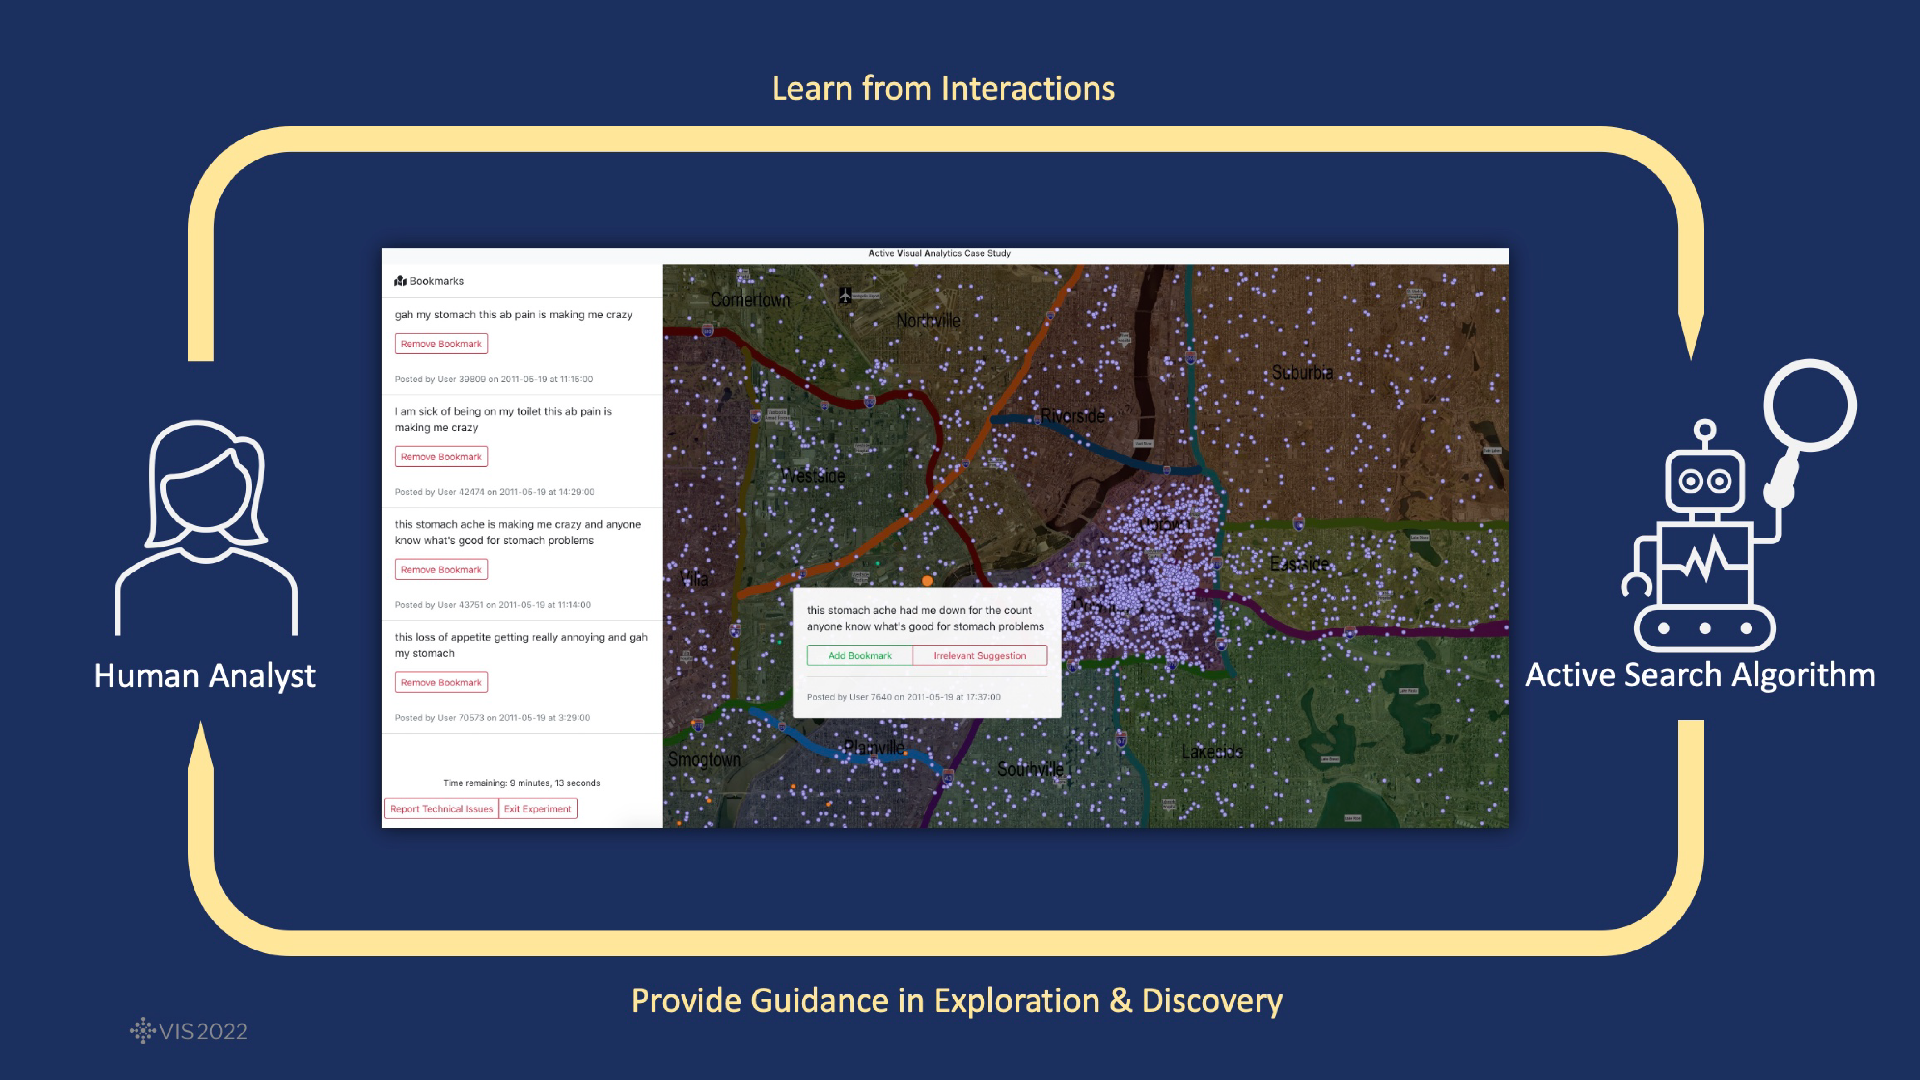
- Guided Data Discovery in Interactive Visualizations via Active Search
- #to-read https://ieeevis.b-cdn.net/vis_2022/pdfs/v-short-1041.pdf
- https://virtual.ieeevis.org/year/2022/paper_v-short-1041.html
- Saw @shayan.monadjemi (Private) (twitter)'s presentation live!
- https://ieeevis.b-cdn.net/vis_2022/paper_images/v-short-1041.png
- Able to recommend next interactions to people based on past recommendations
- Q from me: In this system, what makes a "good" recommendation? During sensemaking, are you optimizing for similarity or novelty in relation to past bookmarks
- (could be either - see recording for more, for now it goes for similarity)
- Q from others: Q: Are you concerned about biasing benign exploration patterns?
- Absolutely, that is a valid concern. I investigated our user study data for data coverage (symptom coverage and location coverage), and I found no significant difference between the control and active search groups. However, this might not be the case for other datasets. My collaborator, Quan, is actually incorporating a notion of “diminishing returns” on the utility function of active search in order to increase the diversity of the recommendations/queries. Feel free to check out his work! Thanks again for all these great questions! Would be happy to chat more.
- my note:
Thank you for these additional reflections and references 🙂 . I assume Quan's work on diminishing returns will show up on this page if it isn't already here: https://krisnguyen135.github.io/publications/
I didn't ask this last question, but it made me think of the general risk of humans being less capable if they become over-dependent on automated systems (simplified example is when people forget to spell when using a plain text editor, because they're so used to typing with spellcheck on).
(digest version + link to the short paper, 6 page) https://blog.acolyer.org/2020/01/08/ironies-of-automation/
-
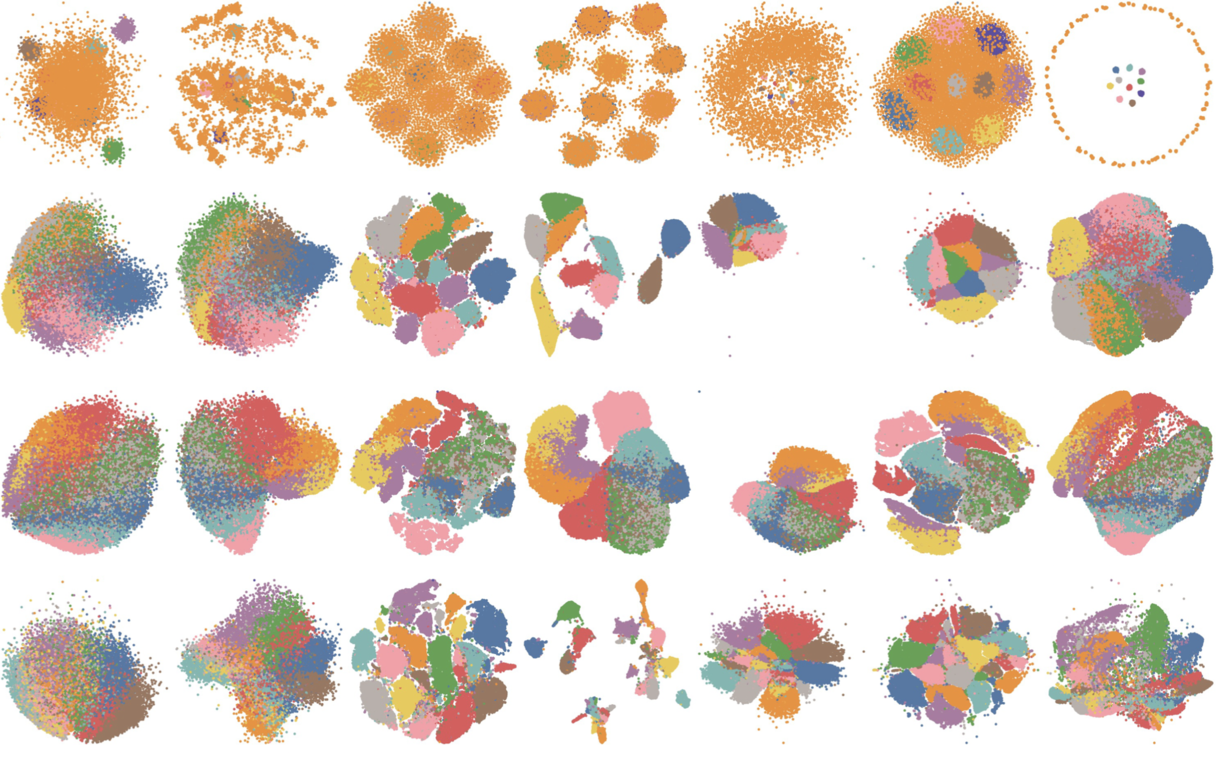
Parametric Dimension Reduction by Preserving Local Structure
- Paper
- https://virtual.ieeevis.org/year/2022/paper_v-short-1028.html
- Addresses a very hard core problem - when you go up to high dims, global structure is lost, some locality is preserved, things get messy with live data
- If data is streaming, how can you make the previous clusters stable?
- Appears to be a techinque that lets you have stable t-sne even with streaming data.
- Online at https://github.com/a07458666/parametric_dr.
-
UMATO ( Uniform Manifold Approximation with Two-phase Optimization )
- Hyeon Jeon
- #demo with python: https://github.com/hyungkwonko/umato
- https://virtual.ieeevis.org/year/2022/paper_v-short-1047.html
- Compete with T-sne, UMAP at preserving local structure and global structure at same time
- Is pipeline on top of UMAP, so is slightly slower
- Qualitatively... global metrics succeed, though t-sne/umap still won at pure local
- Seems like it works with a pass that picks "hub spots" before going to final
- TBD what problem domain this would be useful for outside of visualizing geometric hypercube tests, although he did test it with 3 real-world algos.
Bonus side track: Uncertainty snippet
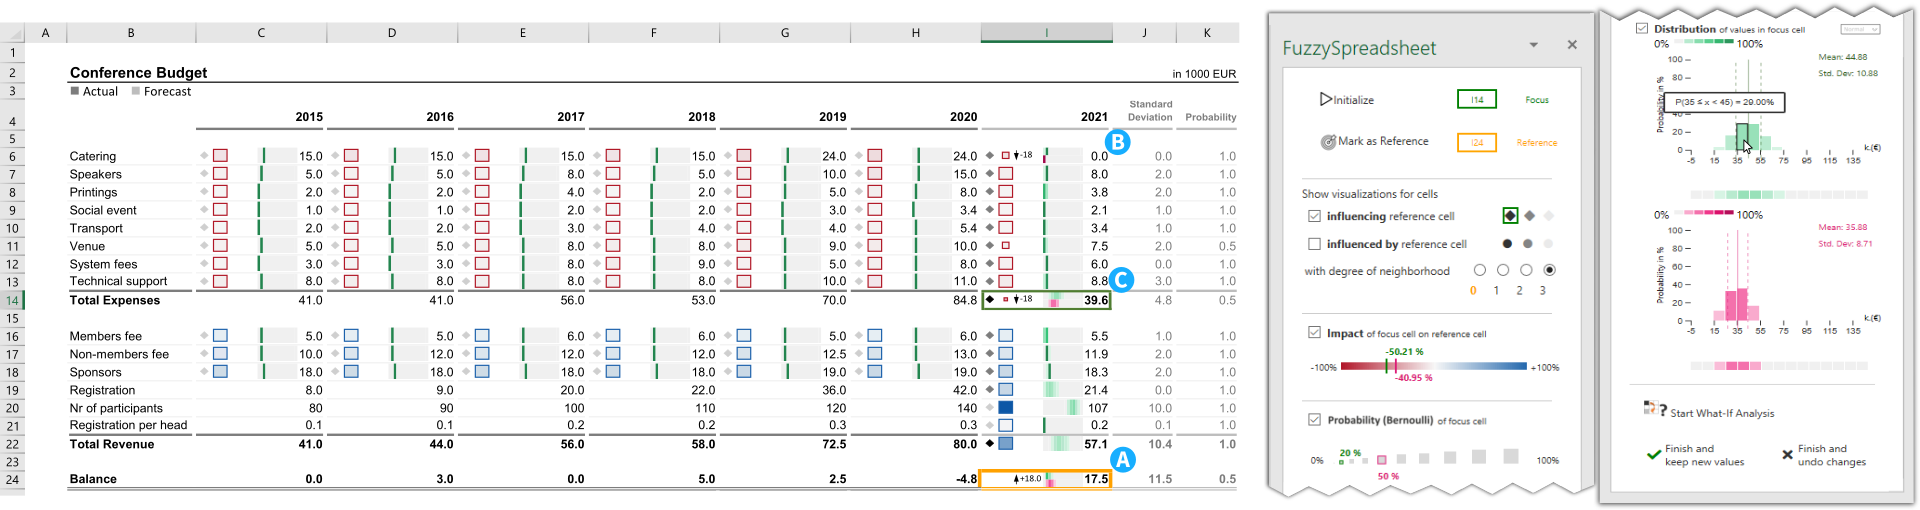
- Learned from Fuzzy Column Spreadsheets in other track on Uncertainty viz
- #to-read / #demo https://jku-vds-lab.at/fuzzy-spreadsheet/
- Fuzzy Spreadsheet: Understanding and Exploring Uncertainties in Tabular Calculations - Viashali Dhanoa
- You can write custom Spreadsheet plugins using Typescript!
- See slides for more pictures... lesson in fittin ginto existing workflows
- Fits into what-if analysis, and puts context in sidepanel in a friendly slideshow environment
- Spreadsheet-based tools provide a simple yet effective way of calculating values, which makes them the number-one choice for building and formalizing simple models for budget planning and many other applications. A cell in a spreadsheet holds one specific value and gives a discrete, over precise view of the underlying model. Therefore, spreadsheets are of limited use when investigating the inherent uncertainties of such models and answering what-if questions. Existing extensions typically require a complex modeling process that cannot easily be embedded in a tabular layout. In Fuzzy Spreadsheet, a cell can hold and display a distribution of values. This integrated uncertainty-handling immediately conveys sensitivity and robustness information. The fuzzification of the cells enables calculations not only with precise values but also with distributions, and probabilities. We conservatively added and carefully crafted visuals to maintain the look and feel of a traditional spreadsheet while facilitating what-if analyses. Given a user-specified reference cell, Fuzzy Spreadsheet automatically extracts and visualizes contextually relevant information, such as impact, uncertainty, and degree of neighborhood, for the selected and related cells. To evaluate its usability and the perceived mental effort required, we conducted a user study. The results show that our approach outperforms traditional spreadsheets in terms of answer correctness, response time, and perceived mental effort in almost all tasks tested.
Hallway Track
-
Visit vissec another week: https://virtual.ieeevis.org/year/2022/session_a-vizsec-2.html\
- Author website: https://jcrouser.github.io/about.html
-
Tabular datavis
- Taggle, LineUp, David Borland paper - see also navio
- https://journals.sagepub.com/doi/full/10.1177/1473871619878085
- Taggle: Combining overview and details in tabular data visualizations
- Digestable: David's version: https://vaclab.unc.edu/publication/vis_2022_borland/vis_2022_borland.pdf
- James Scott-Brown recommended Lineup: https://lineup.js.org/app/
- Taggle, LineUp, David Borland paper - see also navio
-
Foofah: hellerstein interactive data cleaning (wheel) (via github)
-
Notice people using osf instead of github
-
Check kirigami, roboviz game paper
-
Noticed Roundtrip is a similar motivation as NOVA
- https://github.com/hdc-arizona/roundtrip
- Roundtrip is better for bidirectional flow
Hack Ideas
- Implement what Survis does but for new papers
- Try to redo Missingno but with JS interactivity for questionable data points
Scratchpad
- Check awesome streamlit repo: https://github.com/MarcSkovMadsen/awesome-streamlit
- Rxjs (Private) (expand with @Hardy.Jones (Private) note)
Backlinks