Day 5 - Friday
Friday (24 papers!)
- VIS Full Papers: Visual Analytics of Health Data (Bum Chul Kwon)
- Capstone with Kerry Magruder - Visual Thinking / Galileo (Moon)
Highlights
- Health analytics snips
- ClinicalPath: event annotation vis (not just in margin but dedicated explorer)
- Solidify how Bayesian networks work
- Chartwalk: (Honorable mention paper)
- Sparkline per tag type
- Datasette: if there's a time column, can we show vis per time of year/etc?
- Dashboard evaluation framework (not just original "intent" task)
- Explainable AI (user centric) - not just some is better than no explanation -> diff explanations are task + domain specific (Honorable mention paper)
- Capstone:
- Check the notebooks of Galileo: drawing exercises
- What trainings (outside of CS) help you see meaningful patterns in vis? How do we encourage expatation/
Raw Notes
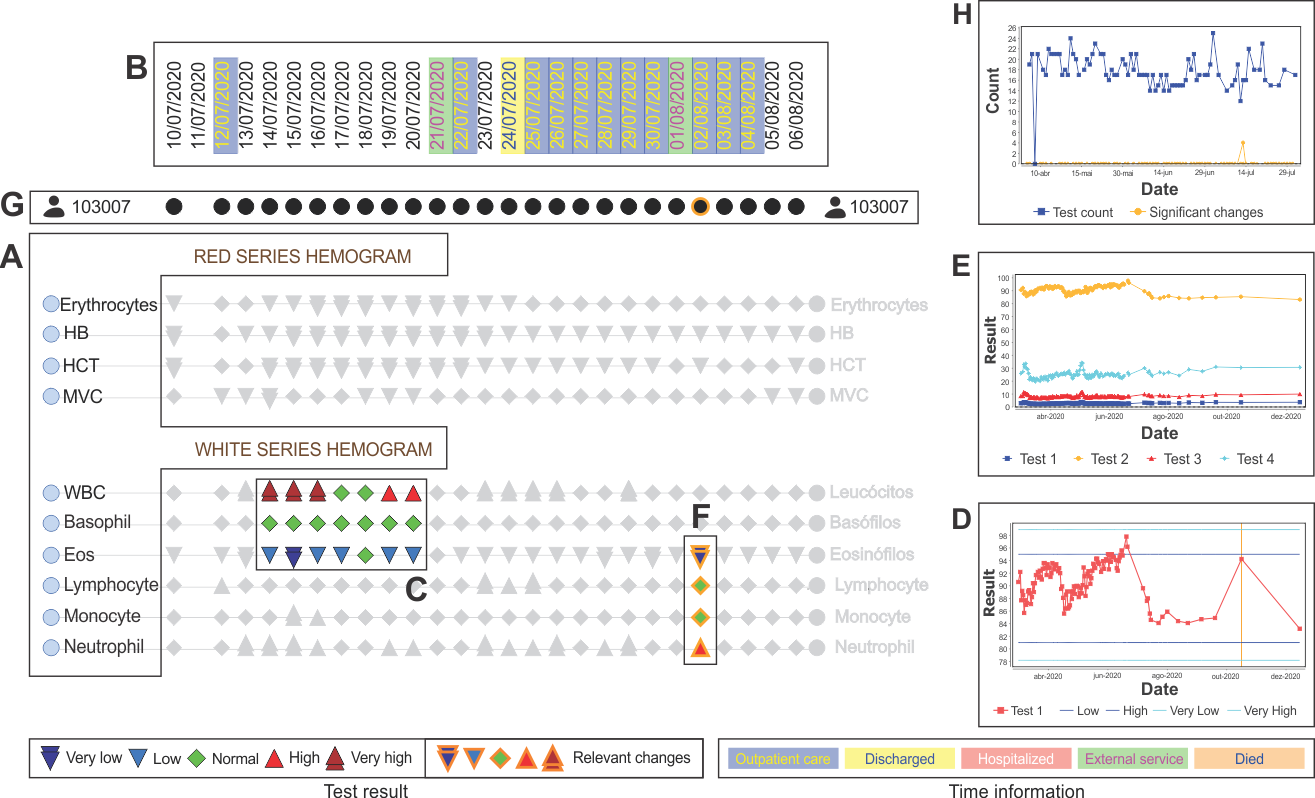
- ClinicalPath: a Visualization tool to Improve the Evaluation of Electronic Health Records in Clinical Decision-Making
- PDF: https://arxiv.org/abs/2205.13570
- Vis for physicians not patients
- Timeseries vis for patient test results over time -> events, color code by type - help with clinical decision making!
- Evaluation: improve physician exp in decision making!
- Meta
- Me: could se apply this to CI test results?
- Example of doing domain-specific vis!
- Visual Assistance in Development and Validation of Bayesian Networks for Clinical Decision Support
- https://virtual.ieeevis.org/year/2022/paper_v-tvcg-9754243.html
- Same presenter as Provectories project from yesterday
- #demo : https://github.com/JulianeMu/BN_development_validation
- Propose causality sequences that end user can adjust if it makes sense
- Edges can be reversed, removed, or affirmed
- Can visualize gap between recommender and ground truth actual.
- Related work
- Visual approach to handling exploratory causal analysis!
- https://arxiv.org/pdf/2009.02458.pdf
- meta
- Human-in-loop approach to helping people try out beysian networks despite lack of prior exposure or on-site computer scientist.
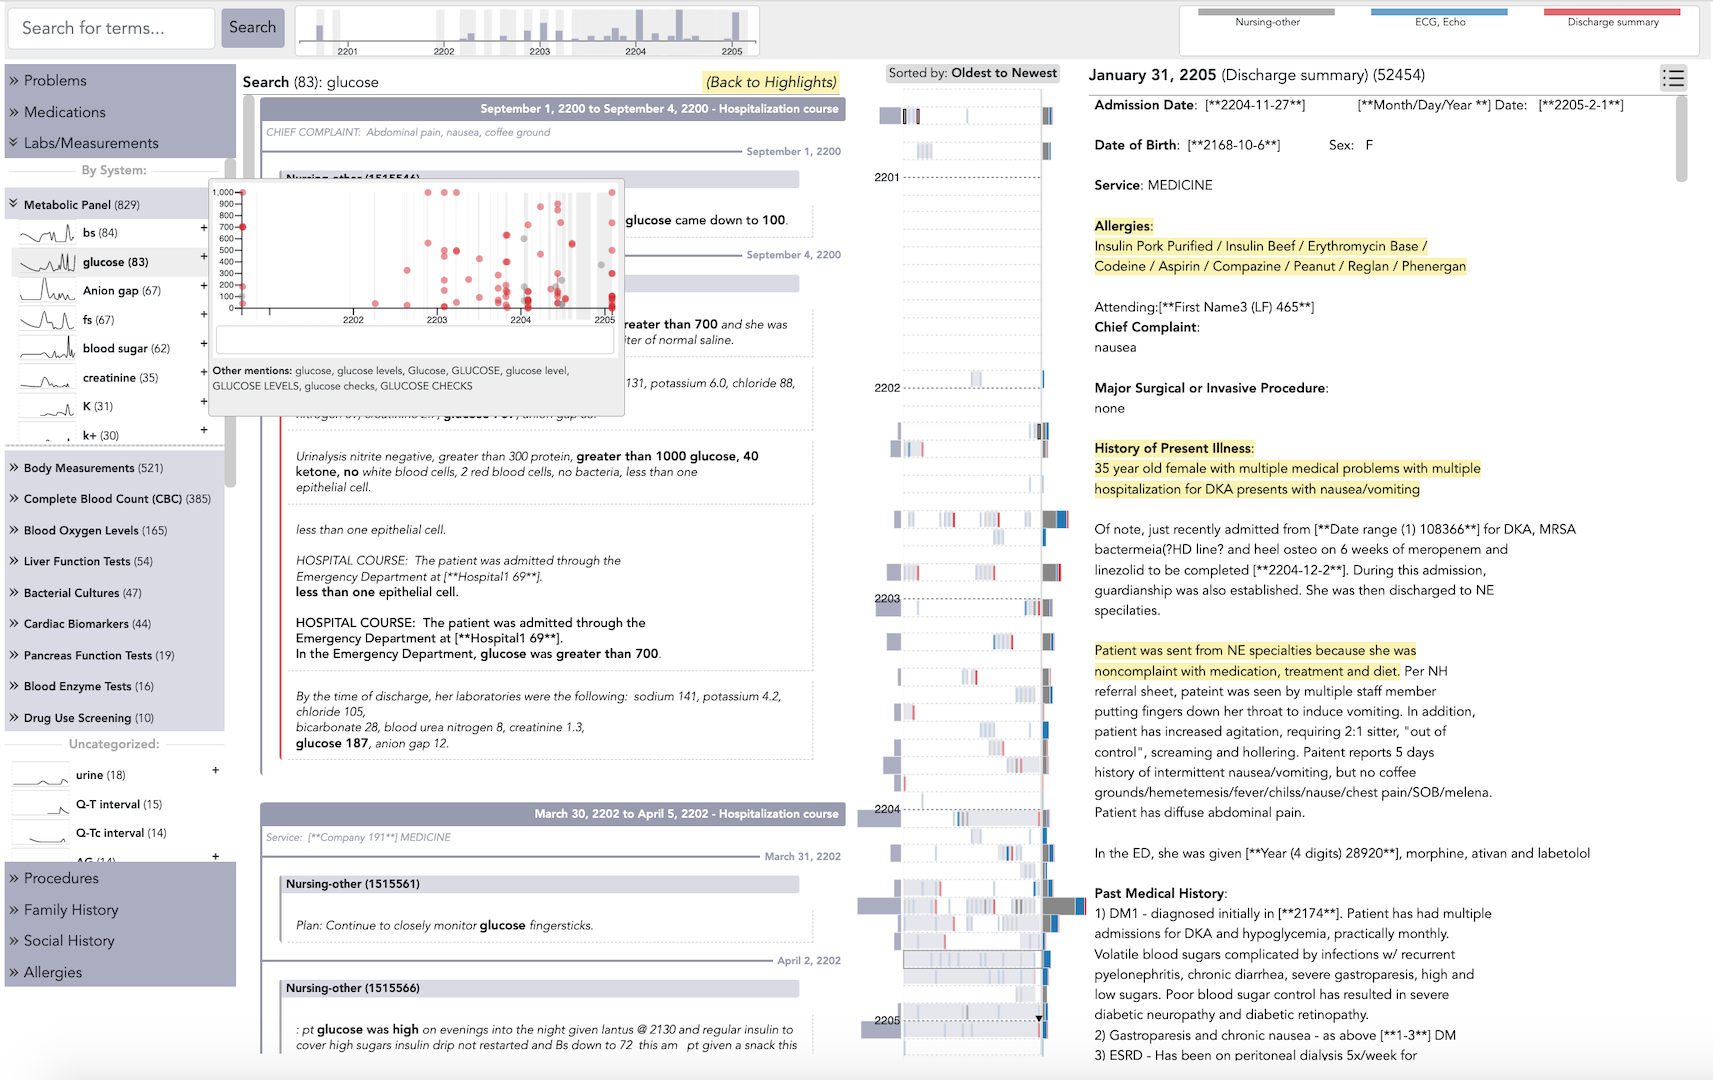
- ChartWalk: Navigating Large Collections of Text Notes in Electronic Health Records for Clinical Chart Review #to-read
- https://ieeevis.b-cdn.net/vis_2022/pdfs/v-full-1228.pdf
- #demo http://chartwalk.cs.toronto.edu/
- Same presenter as Storifier at vis last year (link back to Untitled Timeline Project (Private))
- Nicole Sultanum
- problem
- 32% of time in EHR is spent reading semi-structured text
- Chart review- just a few minutes in emergency room
- Visual summary may be too abstract- sometimes people need to read the raw text, can't skip
- Build on graphics + text combo used in medscope and docustory
- Paper close reading
- Timeline view is important
- getting surrounding context for snippet is important
- Used Google API for NER (topic labeling) for the healthcare documents!
- Curated view provided by other nurse: claims (diabetes) as well as notes substantiating that!
- Sort docs by top appearing subtags.
- INclude close annotation of docs with significant events, like discharge date.
- People liked seeing curated summaries from colleagues!
- Added a bit fo color too, and separate content by note type!
- Addeds sparklines for each tag type...
Group notes by "episode of care" (like a "case" of incidents) based on discharge date
- If item also has numeric value (like blood sugar), then do a TS scatterplot on hover too! Don't just quit at # of mentions, we can use actual values! - Search bar search frequency vis is good for Datasette content that is backed by time meta
- Supply note type by source (physician, nursing, general, case management, etc)
- Paper - visualize what feature the users spent the most time on, and where they focused!
- Reading habit: people always start with deep dive into latest summary before browsing the rest in open ended way.
- Most praised feature: highlighting and bookmarking! (although- who should curate them, do they age?)
- For me... voyager bookmarks were NOT a key feature... intresting to see how this helps with note taking!
- People trust colleageu notes!
- idea: what if you could bold/reduce opacity for negative things (like no edema) to help people focus on key text
- Wish bad/mixable items could be merged...
- Middle: skim highlights from each doc instead of the whole doc.
- Meta
- Tie back to @luke.murray (Private)'s work in Dave Karger lab on better patient medical record notes: https://lukesmurray.com/
- I spent about 5 minutes clicking around... could I use this for browsing conference notes by topic?
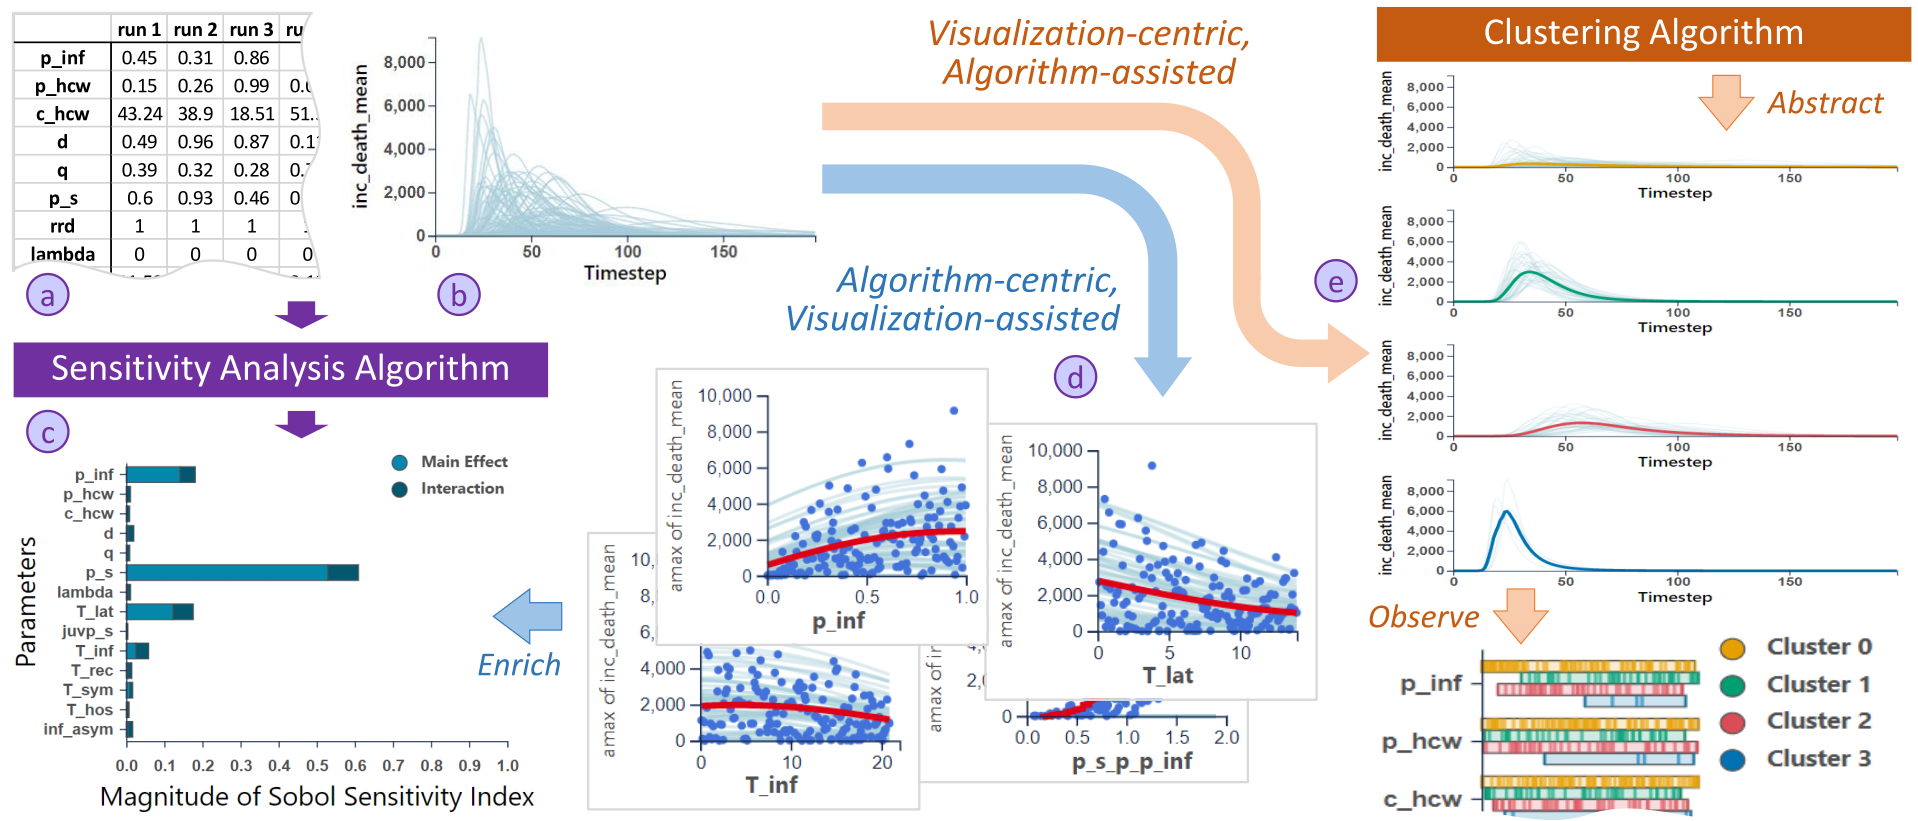
- Development and Evaluation of Two Approaches of Visual Sensitivity Analysis to Support Epidemiological Modeling
- https://ieeevis.b-cdn.net/vis_2022/pdfs/v-full-1111.pdf
- Erik Rydow (Scotland evaluation of sensitivity analysis for modeling COVID
- https://virtual.ieeevis.org/year/2022/paper_v-full-1111.html
- Approaches compared to compare many types of parameters/ model runs ( #human-in-loop (Private) approach!)
- Algorithm first, vis assist or
- Vis-assist, algo second.. applies to general timeseries modeling
- Visuals hint at which features contributed most to quality of different strategies
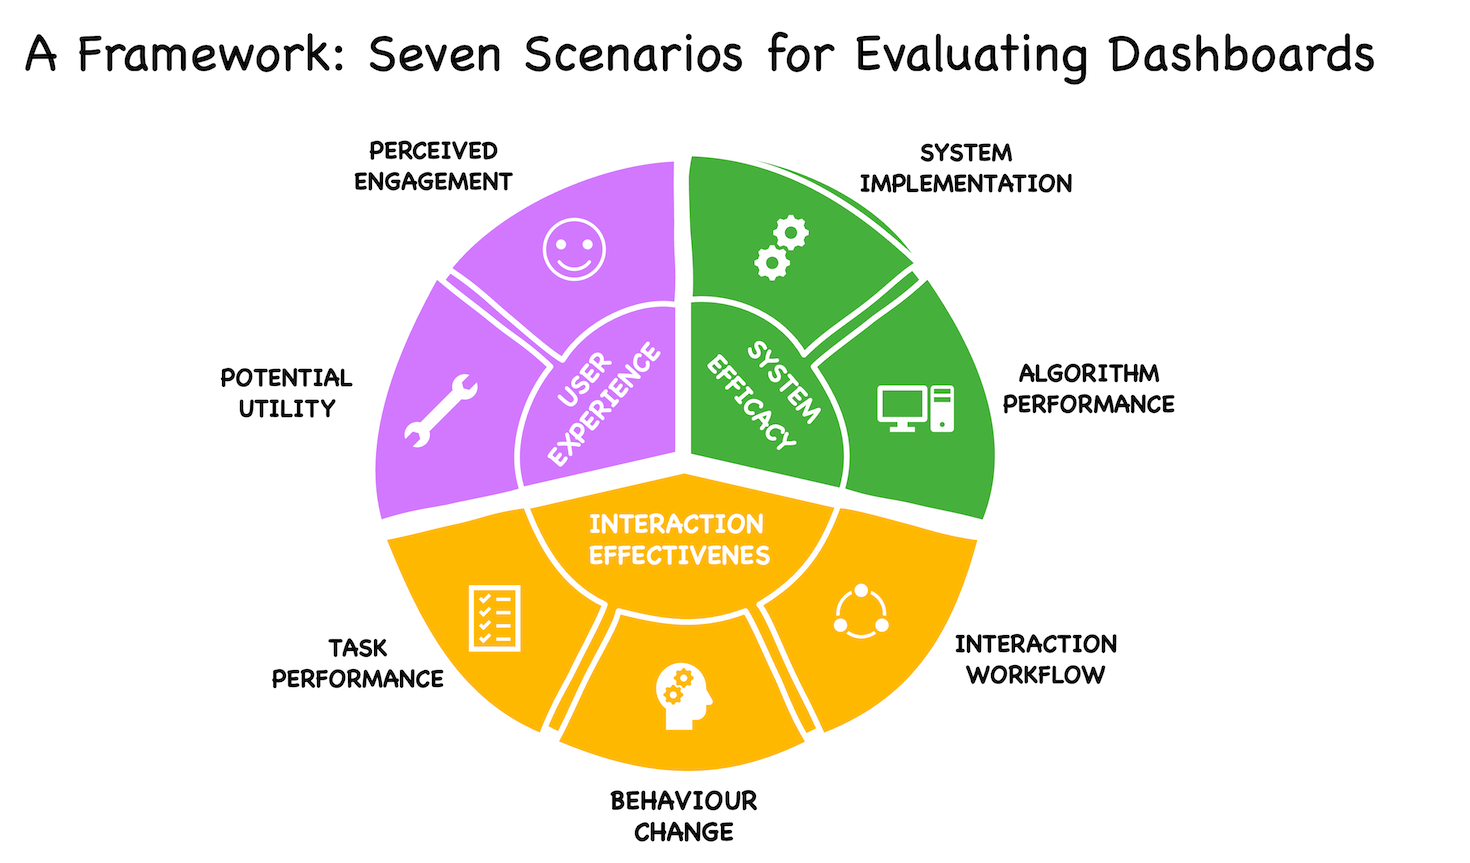
- A framework for evaluating dashboards in healthcare (7 layers)
- https://ieeevis.b-cdn.net/vis_2022/paper_images/v-tvcg-9721816.png
- Mengdie Zhuang (UK) lecturer + PhD student David Concannon
- https://virtual.ieeevis.org/year/2022/paper_v-tvcg-9721816.html
- #to-read: https://arxiv.org/abs/2009.04792
- Dashboard evaluation strategy based on 81 paper review (another survey paper)
- Don't just go for predecined impact... also consider behavioral change, engagement, and
- Ref the @tamara.munzner (Private) paper on nested model
- is important for clinical decision making, healthcare admin, AND public health communication!
- Dimensions in Interaction
- Task performance
- Behavior change
- Interaction workflow
- Dimensions in UX
- perceived engagement, potential utility
- System efficacy
- Algorithmic performance
- System implementation!
- Meta: paper review
- 260 healthacre papers, 81 had at least 1 dashboard eval!
- Browsed findings section: has table covering how to iterate on a COVID dashboard for clarity: point out things are interactive, and explain where the data came from!
- Someday: check if Covid Commitment could appear here.
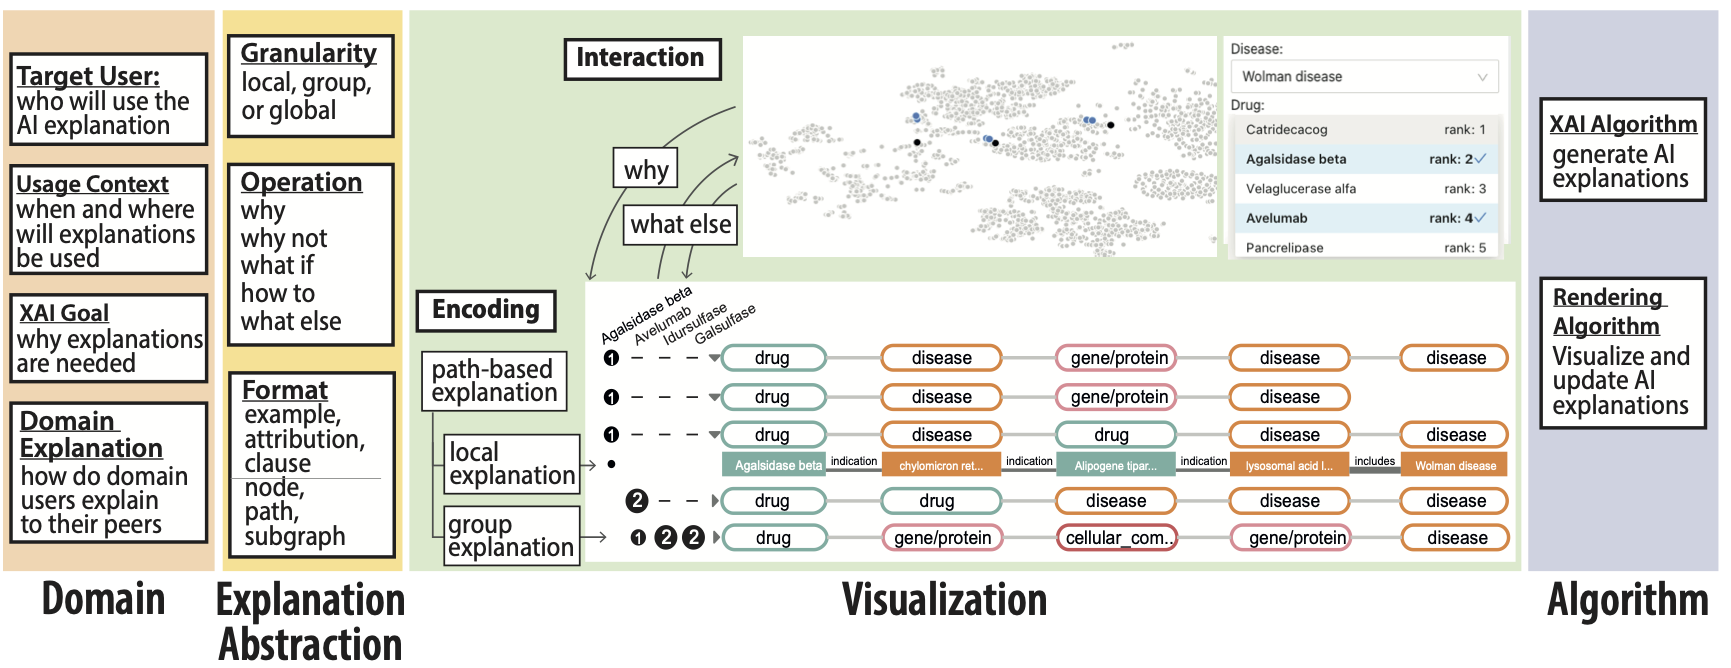
- Extending the Nested Model for User-Centric XAI: A Design Study on GNN-based Drug Repurposing
- https://virtual.ieeevis.org/year/2022/paper_v-full-1584.html
- #to-read: https://ieeevis.b-cdn.net/vis_2022/pdfs/v-full-1584.pdf
- #demo: http://drugexplorer.gehlenborglab.org/ / https://github.com/hms-dbmi/Drug_Explorer
- Qianwen Wang / Nils Gelenborg
- Very well organized presentation on machine learning <> explanations gap
- Other tools just hope that an explanation is better than nothing
- Rule based
- Counterfactual
- Attribution-based
- Show picture region expalnation that turned out to be unusable/misleading
- Good explanation is both DOMAIN and APPLICATION specific!
- Other tools just hope that an explanation is better than nothing
- Reference Vera Wang's work from last year about explainable AIs (TREX workshop)
- Proof of concept app shown
- Meta
- "what does it meant to encode the mind of an expert into a task"
- Move away from picking "1 explanation to rule them all"
- Comparison: neighboring nodes, path, or subgraph way to explain how explanations work.
- Part of broader group of "user-centric explainable AI"
- This was used for a GNN (graph neural network")
- Paper reading
- Explain both "why" and "what else" connections
- Implement with Antd, pytorch, react
- Evaluation: people seemed to like the metaMatrix view for explaining why the explanation showed up.
- Someone who prescribes off-label drugs fel tthis helps him explain why his cases are justifiable.
- STrength of edge in prediction can be confused with strength of the biological prediction
- Give people a real task: people may give inaccurate feedback when asked to evaluate the vis without a concrete task
Closing Keynote - Galileo and Visual Thinking
Galileo's training in visual perspective drawing let him see in the telescope what others missed.
- Kerry's full slides: http://kerrymagruder.com/pdf/Vis-2022.pdf #to-read / recommend
- Capstone brief: https://www.ieeevis.org/year/2022/info/capstone-speaker
- Full video and references to history of the earth PDFs:
- https://vimeo.com/groups/750547/videos/760681165
- Perspective drawing pictures: http://lynx-open-ed.org/perspective #to-read
- Bees: form of "grant proposal" thank you of the 1400s apiariam
- Studied together with other master artists, not just engineers
- Sunspots, anatomy drawings, origin of rock formation
- Was able to glean you can't discern moon shape by looking straight at it - need to watch the edge "scanning".
- Upshot
- Visual thinking as a true "tool for thought" - not just a supplementary decoration
- modes of picture
- NATURALISTIC, DIDACTIC, and EVIDENTIAL
- Visually appealing (calf muscle contracted) for aesthetics
- Didactic: Teach you something, abstract
- EVidential: literal (close to photo)
- Then throw "visual aid" in the middle
- NATURALISTIC, DIDACTIC, and EVIDENTIAL
Miscellaneous
- Double blind / how to get edge papers into VIS
- https://drive.google.com/file/d/1CQyLrPGp2XjLboyMbjdqh1BeVd5_WbK0/view
Other tracks
- Review other days, include
- natural language interfaces
- Graph drawing
- Vis arts program
Backlinks