Monday - Day 2
Monday
- 10 AM VisComm / TestVis (Shelly, Cheese)
- 11:45 AM TestVis (Danyel, Tests)
- VisGuides / VisXAi
- Sheelagh Carpendale Keynote (Heuristics, Guideliens, Best Practices)
- Ian: Design patterns (heh) guidelines from AI explainers
- VisXAi (6 short papers)
Highlights
Session 1
- Learned of Schmoo Plots for chip yield boost. Detail.
- VAOS and Post Silicon Validation UIs -> worth browsing the demos/videos
Session 2
- Observability / Domain Specific (Danyel Fisher, former Sanddance)
- "Choosing the groupby" problem - Check Eugene Wu's Scorpion paper
- Check BubbleUp plot: combine heatmap along with distribution on hover examplars.
- Earth mover algorithms for sorting groupbys (distance between 2 probabilities)
- Submit quality/flakiness CI vis next year
- General purpose DAG vis
Session 3
- Visguides: "Lessons Learned" over "best practices". Browse Edgemaps
- Ian's AI Explainer Design Patterns: slides. Should rewatch opener / diff Interactive Stories
Session 4
- Try Distill template
Raw notes
Session 1

- Missed TestVis keynote, was in VisComm first to see Shelly's presentation (which yielded a comment from Marti Hearst about annotations vs captions!)
- https://ieeevis.b-cdn.net/vis_2022/pdfs/w-viscomm-1006.pdf
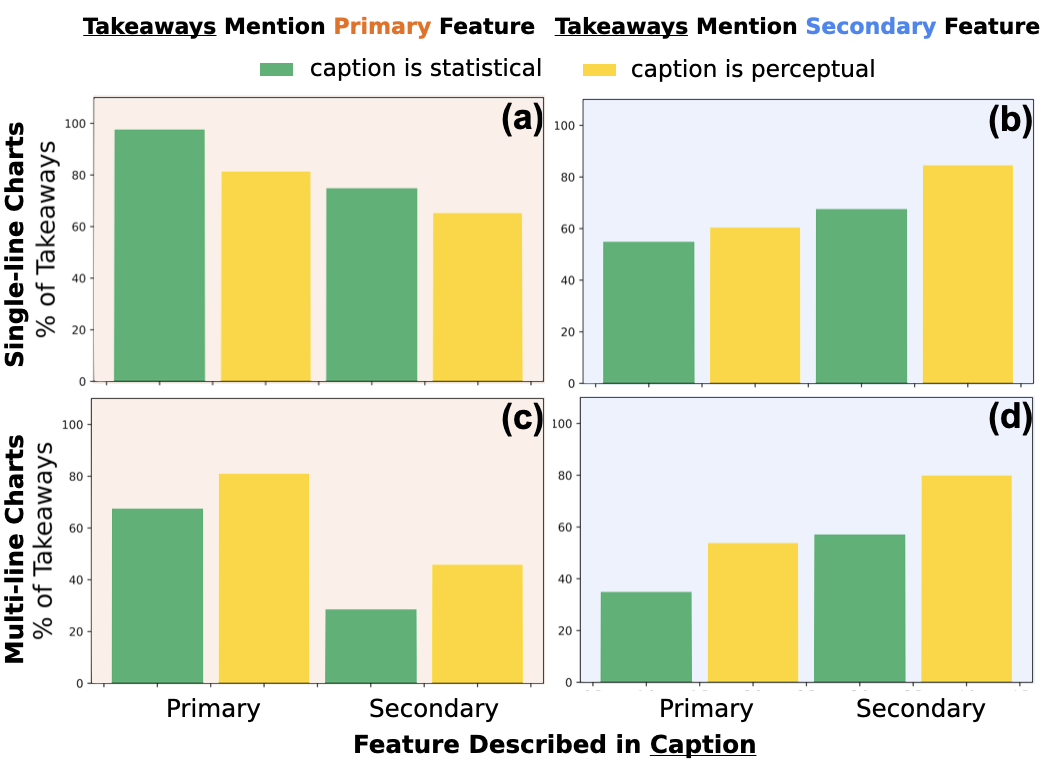
- This figure shows the percentage of takeaways mentioning primary or secondary features in single and multi-line charts when captions vary in two perspectives: the captioned feature and the semantic level. In the upper-left quadrant, the green bars are higher than the yellow bars, indicating statistical level captions highlight primary features in single-line charts more effectively. In the other three quadrants, especially the lower two quadrants, the yellow bars are higher than the green bars. This result shows that perceptual level captions increase the memorability of medium or low salience features, such as primary and secondary features in multi-line charts.
- Mara Solen: visualization literacy: include both construction + reading knowledge in literacy
- Visual Exploration of Rheological Test Results from Soft Materials
- built a mini-datadog-like configurable dashboard (VAOS) which tests stress/strain response of soft materials like cheese
- https://vis-au.github.io/vaos/ . Has video too!
- https://github.com/J-Matzen/VAOS
- Users weren't expecting linked views, may need some training to leverage fully... but as starting point, it automated bulk graph creation!
- Interactive Analysis of Post-Silicon Validation Data
- https://ieeevis.b-cdn.net/vis_2022/pdfs/w-testvis-1000.pdf #reread (Private)
- General approach: help people compare distributions of item clusters when there are 10s of items with 60 + dims
- Is this analagous to comparing service metrics on a bunch of hosts or services?
- Check baselines/pictures from onenote
- Mix expert annotations with raw readings, had convenient data importer
Schmoo Plots
- https://en.wikipedia.org/wiki/Shmoo_plot
- Heatmap like figure, with different properties
- 3 independent variables: frequency, voltage, teperature... check what combinations pass/fail to find success frontier
- Transient blips will lead to "brick wall schmoo"
- Finger schmoo: when a pattern in the graph = specific sections fail (not whole range)
- https://www.design-reuse.com/articles/47330/understanding-shmoo-plots-and-various-terminology-of-testers.html
- Google search
- Schmoo could be in 3d: https://www.semiconductoronline.com/doc/shmooplot-0001
- Parametric sweeps in real time! http://www.3mts.com/3mtsTools_Shmoo.html
Session 2 - TestVis
- Workshop details page: https://testvis.gitlab.io/testvis22/ . Kate Isaacs wrote something nice for every presenter in Discord.
- Fisher keynote #reread (Private)
- testing in production -> testing is attempting to simulate all of production
- Showed demo of the groupby problem
- Need to checkout Eugene Wu'
- Pitch CI app on flakiness / small multiples viz paper for next year
- How Modern Analyses and Visualizations in Teamscale Support Software Testing #reread (Private) - from https://www.cqse.eu/en/solutions/overview/
- Diff against Jimmy approach / codescene
- https://ieeevis.b-cdn.net/vis_2022/pdfs/w-testvis-1001.pdf
- Stack treemaps to show where changes have happened that need to be tested
- run tests in order that is likely to hit your code changes first - save execution time
- "test gaps"
- FLOAT: a framework for visualizing DAGS of compilation data. Deal with cases where small rounding errors emerge from how files are linked
- https://virtual.ieeevis.org/year/2022/paper_w-testvis-1004.html
- https://ieeevis.b-cdn.net/vis_2022/pdfs/w-testvis-1004.pdf
- Discussed how this could generalize to other build system or data engineering DAGs
- Also used GANTT
- Tangent: other build system viz
- Wenbin Fang: build system visualizations https://github.com/wenbinf/vizmake
- https://bazel.build/
- Data engineering
- Prefect, dagster, airflow, airbnb dag vis medium
- Frontend: webpack, nx, babel, https://turborepo.org/, esbuild
Session 3
-
Ian's keynote balances theoretical underpinning with concrete examples! See slides. Should rewatch opener / diff interactive stories
- MLU explain item: https://mlu-explain.github.io/train-test-validation/
- High dimensionality data (grand tours) returns: https://distill.pub/2020/grand-tour/ Data Visualization New York Meetup had an event on high dimensional data visualization . It's an alternative to UMAP/TSNE for making sense of high dimensional space!
- See also interpretable AI book! https://christophm.github.io/interpretable-ml-book/
-
Sheelagh Carpendale: Memorable line scribble example: Guidelines can be learned from anyone unofficially. Best practices, guidelines, give guidance on process over evaluation. Prefer "lessons learned" to "best practices" to avoid over-weighting
- Designed Edgemaps technique: http://sheelaghcarpendale.ca/Research/EdgeMaps
-
K-means explorable: https://virtual.ieeevis.org/year/2022/paper_w-visxai-2556.html . Built while on break between jobs in 2 months fulltime
-
Principles of action
- https://virtual.ieeevis.org/year/2022/paper_w-visxai-7873.html
- Had trouble following this one, uses tensorflowJS to apply a physics concept to something
Session 4
- Visguides page: https://visguides-workshop.github.io/
- Workshop page: https://visxai.io/
- Large language model bias: https://lm-bias.lingvis.io/
- Stereotypes sometimes match, sometimes are reversed
- Degree of bias depends on which layer of BERT is used.
- Wavelet explainer:
- https://julheg.github.io/waveletexplainability/
- Can you see why an image was classified a certain way?
- Let you fiddle with a mask to see how pertubing the input changes the result to give you a better sense of what rec comes back?
- What should we watch tonight
- Explaing how commercial media recommenders work: https://ibrahimalhazwani.github.io/distill-xai/
- Used a DL model from adtech
- Suggest that one size fits all model doesn't know how to take input from user into account when making recs...
- It's collaborative rather than content filtering based for now, can't tell what a user's rating will e...
- Poisoning attacks: https://uvasrg.github.io/poisoning/
- Small tricks to get the classifier to label things differently from what you originally hoped
- Focused on synthetic data
- Attack difficulty depends on how separated the classes are
- Simulated a census data attack (try to guess person income)
- Contribution: go from hand-constructing working attacks, to being able to generate them
- Wikipedia Map AI (Nomic): https://home.nomic.ai/visxwiki
- https://benschmidt.org/gallery/
- They have a python API: https://github.com/nomic-ai/nomic
- https://docs.nomic.ai/collection_of_maps.html has sample maps of language files
- Comic book for causal inference (used distill pub )
Sessions not attended but marked
- Viz4Climate
- Organizer... make it acessible to vis your own personal stripey data
- https://showyourstripes.info/s/northamerica/all
- Full roundup of event thumbs: https://svs.gsfc.nasa.gov/events/Viz4Climate/
- Rebrowsed MIT vis lab website: http://vis.csail.mit.edu/
- Opensyllabus Database: https://opensyllabus.org/result/author?id=Abraham+Silberschatz
- For fun
- Random paper generator: https://xopaleny.pages.fi.muni.cz/metapaper/
- Parody generator: https://en.wikipedia.org/wiki/Poe%27s_law
- Teaching vis metrics in humanities: https://www.metricsanddatavisualization.com/assignments
- Notetaking tools: people like Joplin: https://github.com/laurent22/joplin
Twitter follows
- Review of "interaction logs to high level visualization taxonomies"
- Ian Johnson: build a twitter bot: https://twitter.com/enjalot/status/1578078061106544661?s=20&t=PqceLqvkNCzLmKhJad13mw
Tags / SEO
Backlinks